


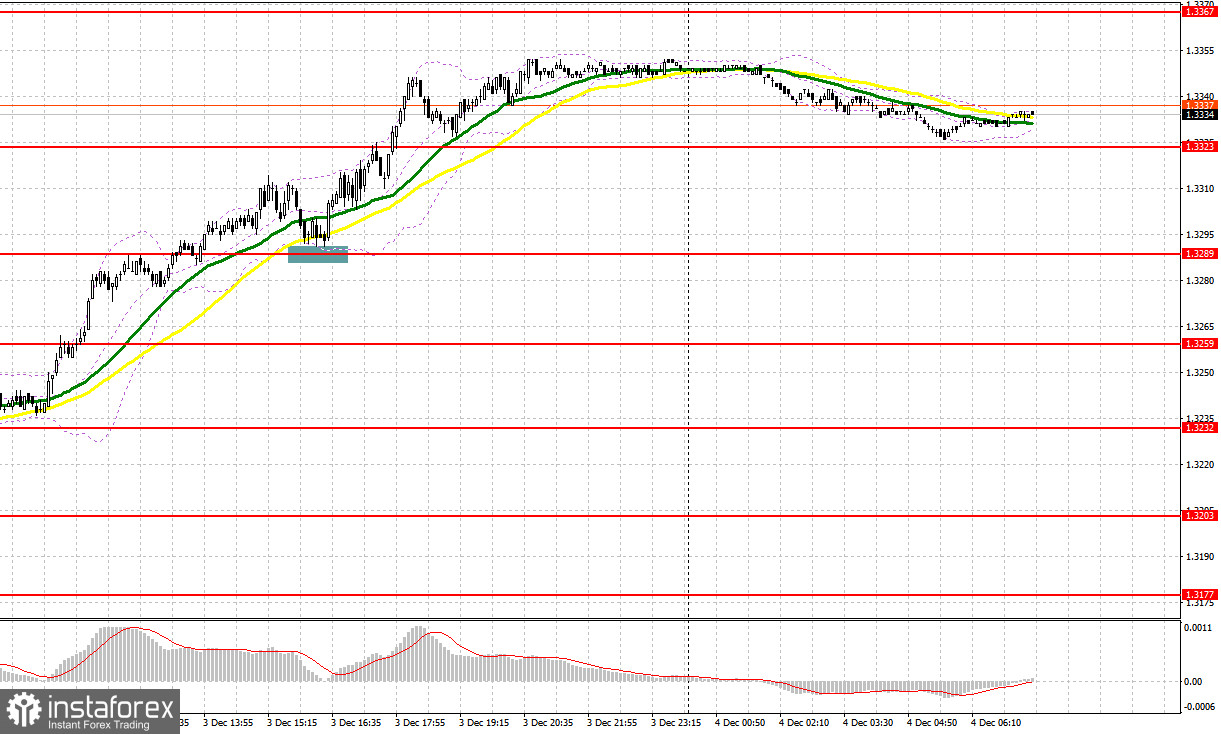
Yesterday, several entry points into the market were formed. Let's take a look at the 5-minute chart and analyze what happened. In my morning forecast, I focused on the level of 1.3250 and planned to make entry decisions based on it. The rise and formation of a false breakout around 1.3250 led to a short entry point for the pound, but after a decline of the pair by 15 pips, demand returned. In the second half of the day, the drop and the formation of a false breakout around 1.3289 led to a buy entry point for the pound further along the trend, resulting in a rise of more than 40 pips.
To Open Long Positions on GBP/USD:
The British pound continued its rapid rise against the dollar after ADP employment in the U.S. decreased by 32,000 in November. Given the positive morning reports regarding service sector activity in the UK, traders had no choice but to continue buying GBP/USD. This morning, retail sales figures for the UK's construction sector and a speech by Bank of England MPC member Catherine L. Mann are expected. Positive reports will help the pound grow. If the data is weak, buyers will need to show themselves around the support level of 1.3323, which was previously resistance. The formation of a false breakout there will provide an entry point for long positions, with a target towards the resistance at 1.3360, this month's high. A breakout and a reverse test of this range will increase the chances of further GBP/USD strengthening, triggering sellers' stop orders and providing an appropriate entry point for long positions, with potential exits at 1.3395. The furthest target will be around 1.3416, where I plan to take profits. In the event of a decline in GBP/USD and a lack of buyer activity at 1.3323, pressure on the pair will return, leading to movement towards the next support at 1.3293. Only the formation of a false breakout there will be a suitable condition for buying the euro. Long positions will be opened immediately on the rebound from the low of 1.3266 with a target upward correction of 30-35 pips intraday.
To Open Short Positions on GBP/USD:
Sellers of the pound are facing challenges and are practically invisible. But it's not surprising, considering the reports released. I expect their first appearance only around the 1.3360 resistance level. Only the formation of a false breakout there will provide an entry point for short positions targeting a move toward the support at 1.3323, where moving averages align with the bulls. A breakout and a reverse test from below this range against the backdrop of very weak retail sales data, along with a reverse test from bottom to top, will become another suitable scenario for opening short positions targeting the area of 1.3293. The furthest target will be around 1.3266, where I will take profits. In the case of further upward movement in GBP/USD and a lack of active bearish actions around 1.3360, buyers will have a good opportunity to continue developing the bullish market. In this case, short positions would be best postponed until a larger level at 1.1703. Selling there will only occur after a failed consolidation. I plan to open short positions immediately on the rebound from 1.3416 with a target downward correction of 30-35 pips.
Recommended for Review:
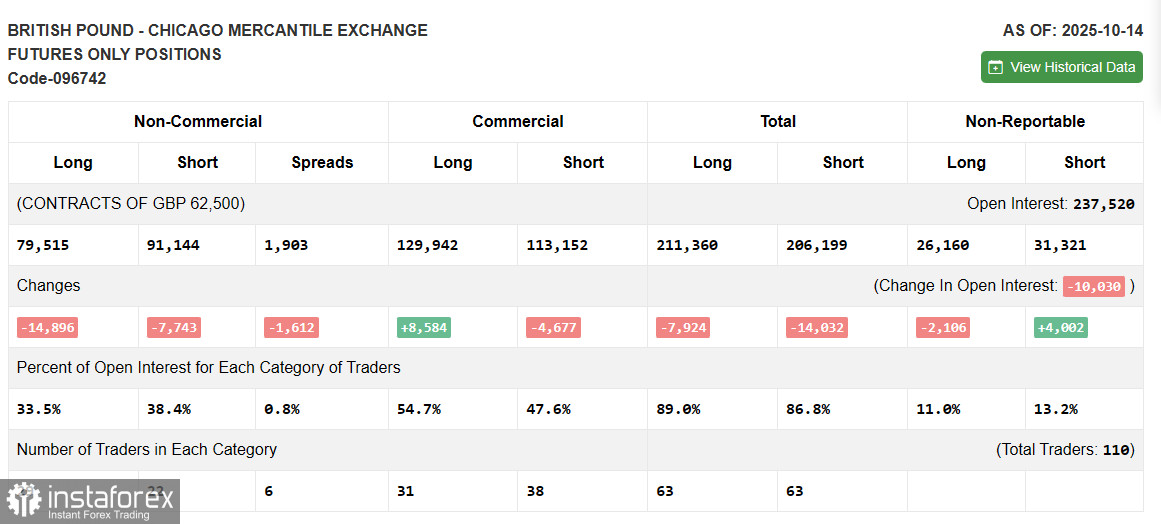
Due to the U.S. government shutdown, fresh Commitment of Traders data is not being published. As soon as the current report is prepared, we will publish it immediately. The latest relevant data is only from October 14.
In the COT report, there was a reduction in both long and short positions. Expectations of further Federal Reserve rate cuts continue to put pressure on the U.S. dollar. The COT report indicated that long non-commercial positions decreased by 14,896 to 79,515, while short non-commercial positions fell by 7,743 to 91,144. As a result, the spread between long and short positions decreased by 1,612.
Indicator Signals:
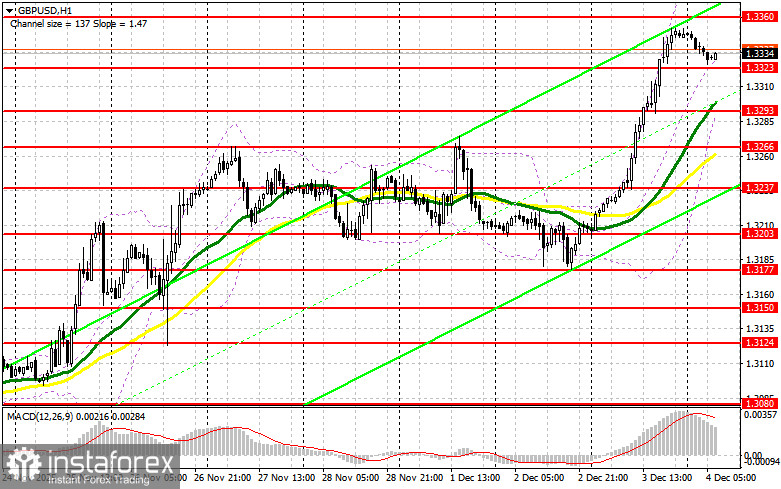
- Moving Averages: Trading is above the 30- and 50-day moving averages, indicating growth for the pound.
- Note: The period and prices of the moving averages are considered by the author on the hourly chart (H1), differing from the general definition of classic daily moving averages on the daily chart (D1).
- Bollinger Bands: In the event of a decline, the indicator's lower boundary around 1.3293 will act as support.
Description of Indicators
- Moving Average (determines the current trend by smoothing volatility and noise). Period – 50. Marked in yellow on the chart.
- Moving Average (determines the current trend by smoothing volatility and noise). Period – 30. Marked in green on the chart.
- MACD Indicator (Moving Average Convergence/Divergence). Fast EMA – period 12. Slow EMA – period 26. SMA – period 9.
- Bollinger Bands. Period – 20.
- Non-commercial traders – speculators such as individual traders, hedge funds, and large institutions that use the futures market for speculative purposes and meet specific requirements.
- Long non-commercial positions represent the total long open position of non-commercial traders.
- Short non-commercial positions represent the total short open position of non-commercial traders.
- The total non-commercial net position is the difference between the short and long positions of non-commercial traders.


