


Analysis of Friday's Trades:
1H Chart of the GBP/USD Pair
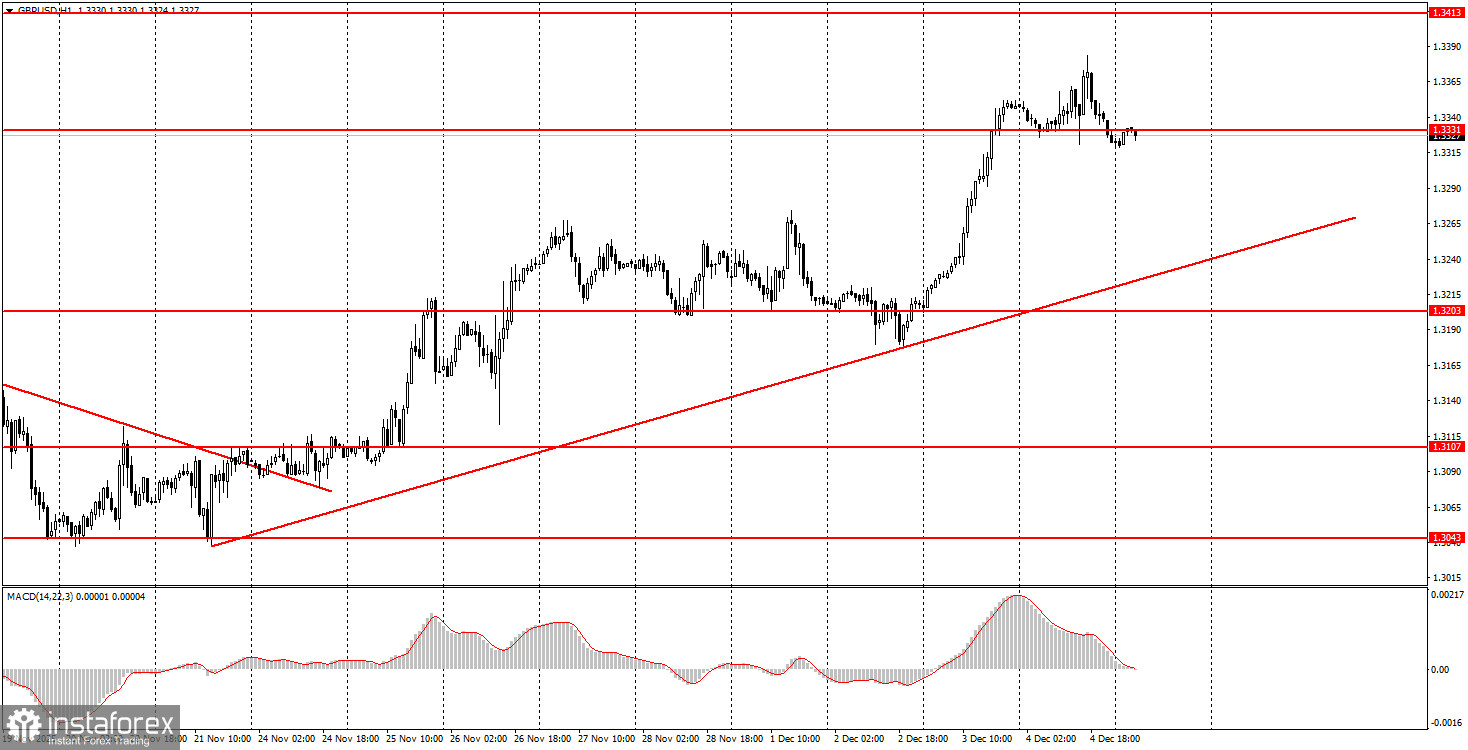
The GBP/USD pair showed a disappointing performance on Friday, a reminder of the excellent first half of 2025, when high-volatility trending moves occurred almost every day. The same reports from across the ocean triggered a similar meager market reaction in the GBP/USD pair—a strengthening of the dollar by 25-30 pips. The events calendar in the UK was empty, resulting in virtually no movements during the first half of the day. Overall, the upward trend remains relevant, and novice traders can expect further growth. Support for the British pound comes from the support area of 1.3319-1.3331 (the updated area), so a new rise in the pair can be anticipated today. Of course, expecting strong movement on a "boring Monday" is unrealistic, but given the current realities, a profit of even 20-30 pips is a very good result. This week, the FOMC meeting will take place, which gives hope for increased movements and higher volatility. There is a high probability that the Federal Reserve will lower the key rate, so the pair's growth may continue in line with the current trend on the hourly timeframe.
5M Chart of the GBP/USD Pair
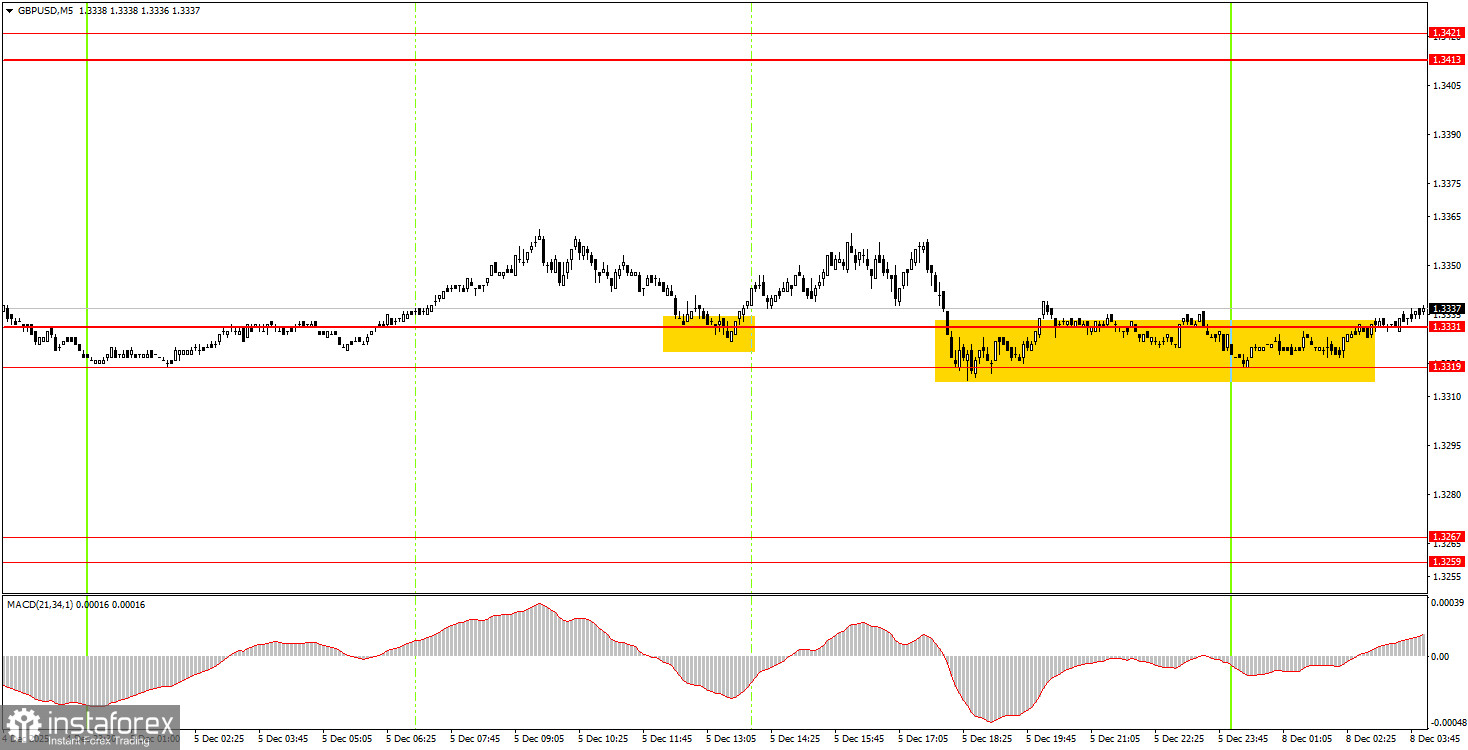
On the 5-minute timeframe, the price bounced three times from the 1.3319-1.3331 area on Friday. The first bounce occurred overnight. Novice traders could have opened long positions based on these clear and simple signals, but in all cases, the maximum rise of the pair was only 20 pips. It's noteworthy that buy signals were formed at the lowest price area of the day, meaning traders effectively entered positions at very favorable prices. However, even this did not lead to higher profits.
How to Trade on Monday:
On the hourly timeframe, the GBP/USD pair has resumed forming a local upward trend. As mentioned before, there are no global grounds for medium-term dollar growth, so we expect movement only to the North. The correction/flat on the daily timeframe may not yet be complete, but any local trend on the hourly timeframe indicates a potential resumption of the global trend.
On Monday, novice traders can again expect trading signals to form within the area of 1.3319-1.3331. A bounce from this area will allow for the opening of new long positions with a target of 1.3413. A consolidation below this area will lead to short positions with a target of 1.3259-1.3267.
On the 5-minute timeframe, levels to consider include 1.2913, 1.2980-1.2993, 1.3043, 1.3096-1.3107, 1.3203-1.3212, 1.3259-1.3267, 1.3319-1.3331, 1.3413-1.3421, 1.3466-1.3475, 1.3529-1.3543, and 1.3574-1.3590. On Monday, no significant events are scheduled in either the UK or the US, but throughout the week, there will be some interesting developments to watch. Most likely, we are in for another "boring Monday."
Key Rules of the Trading System:
- The strength of a signal is assessed by the time it takes to form the signal (bounce or breakout). The less time it takes, the stronger the signal.
- If two or more trades were opened near any level based on false signals, all subsequent signals from that level should be ignored.
- In a flat, any pair can create numerous false signals or none at all. In any case, it's better to stop trading at the first signs of a flat.
- Trades are opened during the period between the start of the European session and the middle of the American session, after which all trades must be closed manually.
- On the hourly timeframe, when trading based on signals from the MACD indicator, it is preferable to trade only when good volatility is present, and a trend is confirmed by a trend line or channel.
- If two levels are positioned too closely to each other (5 to 20 points), they should be viewed as a support or resistance area.
- After moving 20 pips in the right direction, set the Stop Loss to breakeven.
Chart Explanation:
- Support and Resistance Levels: Levels that serve as targets for opening buys or sells. Take Profit levels can be placed near them.
- Red Lines: Channels or trend lines that reflect the current trend and indicate the preferred direction for trading.
- MACD Indicator (14, 22, 3): A histogram and signal line, a supplementary indicator that can also be used as a source of signals.
Important Note: Significant speeches and reports (always included in the news calendar) can greatly influence the movement of the currency pair. Therefore, during their release, it is advisable to trade cautiously or exit the market to avoid sharp reversals against the preceding movement.
Remember: For beginners trading in the Forex market, it is important to understand that not every trade can be profitable. Developing a clear strategy and practicing money management are keys to long-term trading success.


