


Trend Analysis (Fig. 1).
On Monday, from the level of 1.1641 (the close of Friday's daily candle), the market may begin moving upward toward 1.1689 – a historical resistance level (blue dashed line). Upon reaching this level, a downward movement of the price is possible with a target of 1.1685 – the 14.6% retracement level (red dashed line).
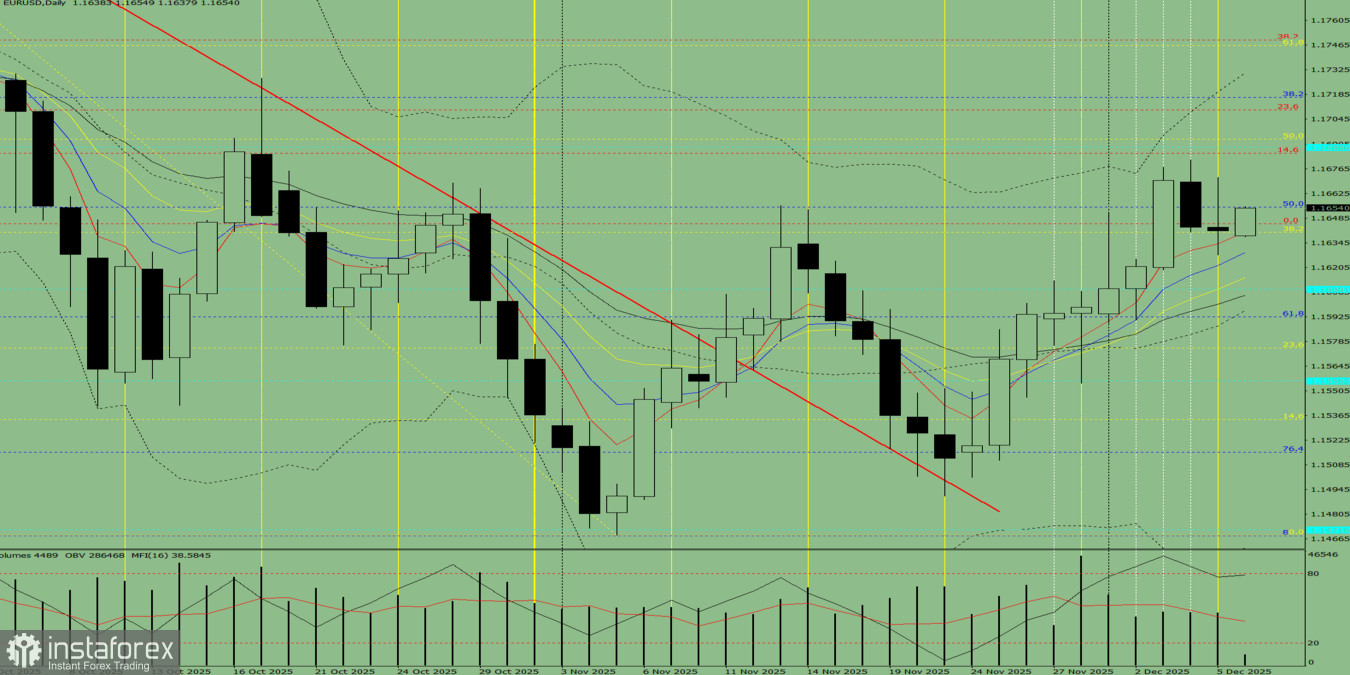
Fig. 1 (daily chart).
Comprehensive Analysis:
- Indicator analysis – up
- Fibonacci levels – up
- Volumes – up
- Candlestick analysis – up
- Trend analysis – up
- Bollinger Bands – up
- Weekly chart – up
Overall conclusion: upward trend.
Alternative scenario: From the level of 1.1641 (the close of Friday's daily candle), the price may begin moving upward toward 1.1671 – the upper fractal (daily candle of December 5, 2025). Upon reaching this level, a corrective downward movement is possible with a target of 1.1655 – the 50% retracement level (blue dashed line).


