


The GBP/USD currency pair traded on Monday as if it were at a wake. Over the past two weeks, the British pound has risen nicely, aligning with our expectations, but this growth is insufficient to signal a resumption of the global trend for 2025. The current situation is best observed on the daily chart. Traders don't even need complex indicators or graphical analyses to understand what is happening. It is enough to open the 24-hour timeframe to see the entire year of 2025. We can observe that the pair has been rising for about six months and is now undergoing a correction. What follows from this?
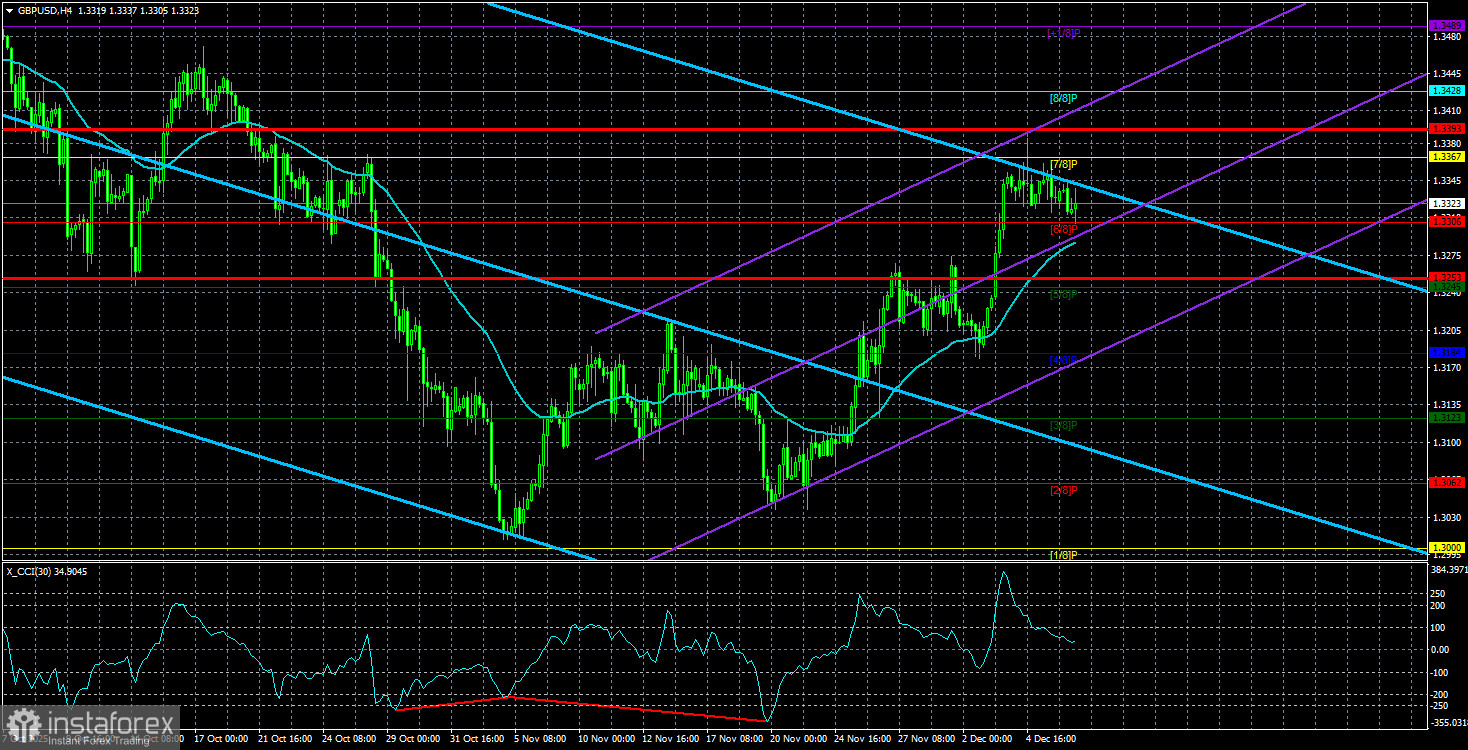
It follows that the correction on the daily timeframe may be nearing completion, but it should not yet be considered as such. Traders who regularly read our articles are familiar with the Senkou Span B line of the Ichimoku indicator. This line is the strongest, and overcoming it is always difficult. Last week, we stated that the target for the current British currency growth is the level of 1.3364, where the Senkou Span B line lies on the daily timeframe. Last week, this line was reached, and the rise of the British currency halted.
Thus, the GBP/USD pair continues to trade based predominantly on technical factors, entirely detached from the fundamental and macroeconomic background. If the market had paid attention to the fundamentals over the past months, the dollar would have resumed its fall into the abyss last autumn. Recall that in early October, Donald Trump imposed new trade tariffs, followed by the start of the "shutdown," and since September 17 (when the last downturn of the pair on the daily timeframe began), the Federal Reserve has lowered the key rate twice. This week, it will do so a third time. With this fundamental backdrop, the dollar has risen for two months. Is there logic in this? No, and we keep reiterating this point.
A minor pullback down may be observed now, and then the market will attempt to overcome the 1.3364 level once again. If this attempt is successful, the global upward trend will likely resume. We believe that the pair could rise above the 1.3364 level sometime this week. It should be understood that in recent months, the pair has moved illogically; therefore, the standard logic of "the market has already priced in the Fed's decision" is not currently applicable. Or, at the very least, it may not work. If the market has priced in the Fed's December rate decision, then why hasn't it priced in the September and November ones?
Thus, we, as before, are only expecting the British pound to rise, and there are many reasons for such a move. One should remember that Donald Trump is a proponent of a "weak dollar," and he continues to demand the lowest possible rates from the Fed. In any case, the Fed's monetary policy will continue to ease, Trump will keep pressing Powell and his colleagues, and U.S. policy will develop fully detached from the goal of "maintaining the dollar's value." Essentially, the more absurd decisions the U.S. president makes now, the cheaper the dollar becomes, and the better it is for the U.S. as the country's exports start to increase, which is the goal of the White House leader.
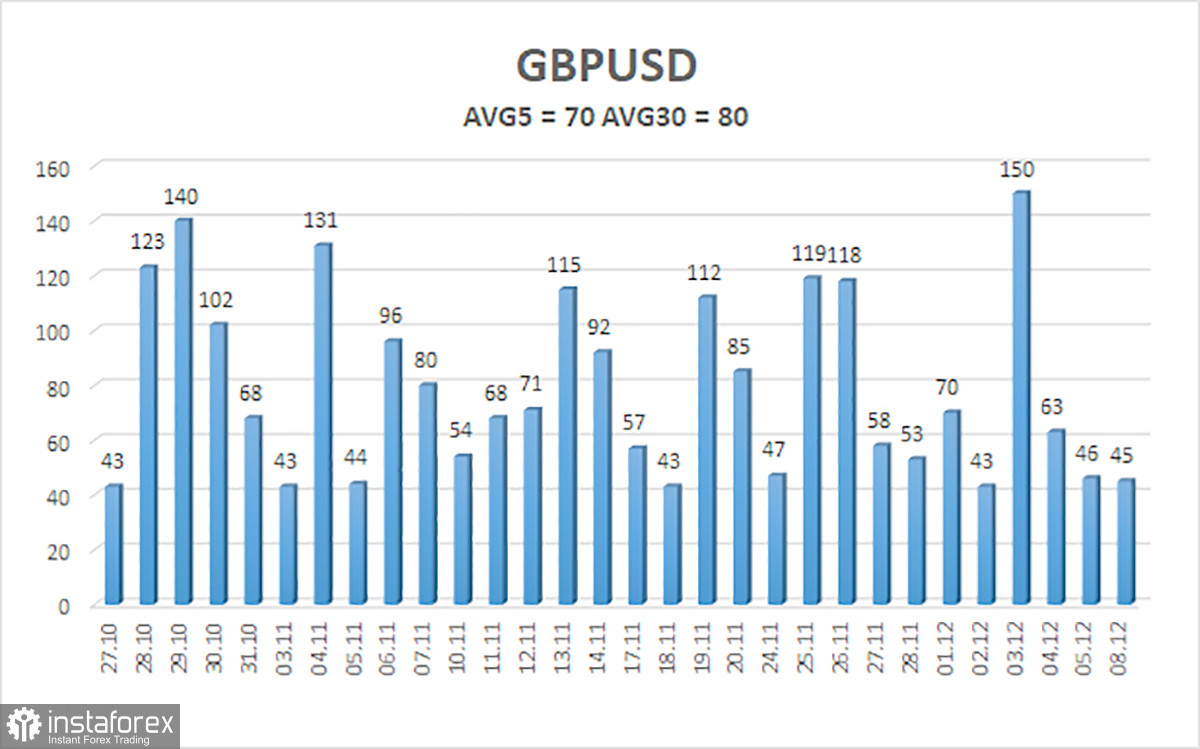
The average volatility of the GBP/USD pair over the last five trading days is 70 pips, which is considered "average" for the pound/dollar pair. Thus, on Tuesday, December 9, we expect the pair to trade between 1.3253 and 1.3393. The higher channel of linear regression is directed downwards, but only due to technical corrections on higher timeframes. The CCI indicator has entered the oversold area 6 times over the last few months and has formed several "bullish" divergences, which have consistently warned of a resumption of the upward trend. Last week, the indicator "visited" the overbought area, so a downward pullback is possible.
Nearest Support Levels:
S1 – 1.3306
S2 – 1.3245
S3 – 1.3184
Nearest Resistance Levels:
R1 – 1.3367
R2 – 1.3428
R3 – 1.3489
Trading Recommendations:
The GBP/USD currency pair is attempting to resume the upward trend for 2025, and its long-term prospects have not changed. Trump's policies will continue to exert pressure on the dollar, so we do not expect the U.S. currency to appreciate. Thus, long positions with targets at 1.3428 and 1.3489 remain relevant in the near term as long as the price remains above the moving average. If the price is below the moving average line, small short positions can be considered with a target at 1.3184 on technical grounds. From time to time, the U.S. currency shows corrections (in the global sense), but it requires signs of an end to the trade war or other global positive factors for the trend to strengthen.
Illustration Explanations:
- Price Levels (Support/Resistance): Thick red lines where movement may end. They are not sources of trading signals.
- Kijun-sen and Senkou Span B Lines: Strong lines of the Ichimoku indicator transferred to the hourly timeframe from the 4-hour timeframe.
- Extreme Levels: Thin red lines where the price has previously bounced. These are sources of trading signals.
- Yellow Lines: Trendlines, trend channels, and other technical patterns.
- Indicator 1 on COT Charts: Represents the net position of each trader category.


