


Trend Analysis (Fig. 1)
On Tuesday, from the level of 1.3317 (yesterday's daily candle close), the market may begin moving upward toward the target of 1.3367 — the 50% retracement level (blue dashed line). When testing this level, the price may possibly start moving downward toward 1.3345 — the upper fractal (daily candle of December 8, 2025).
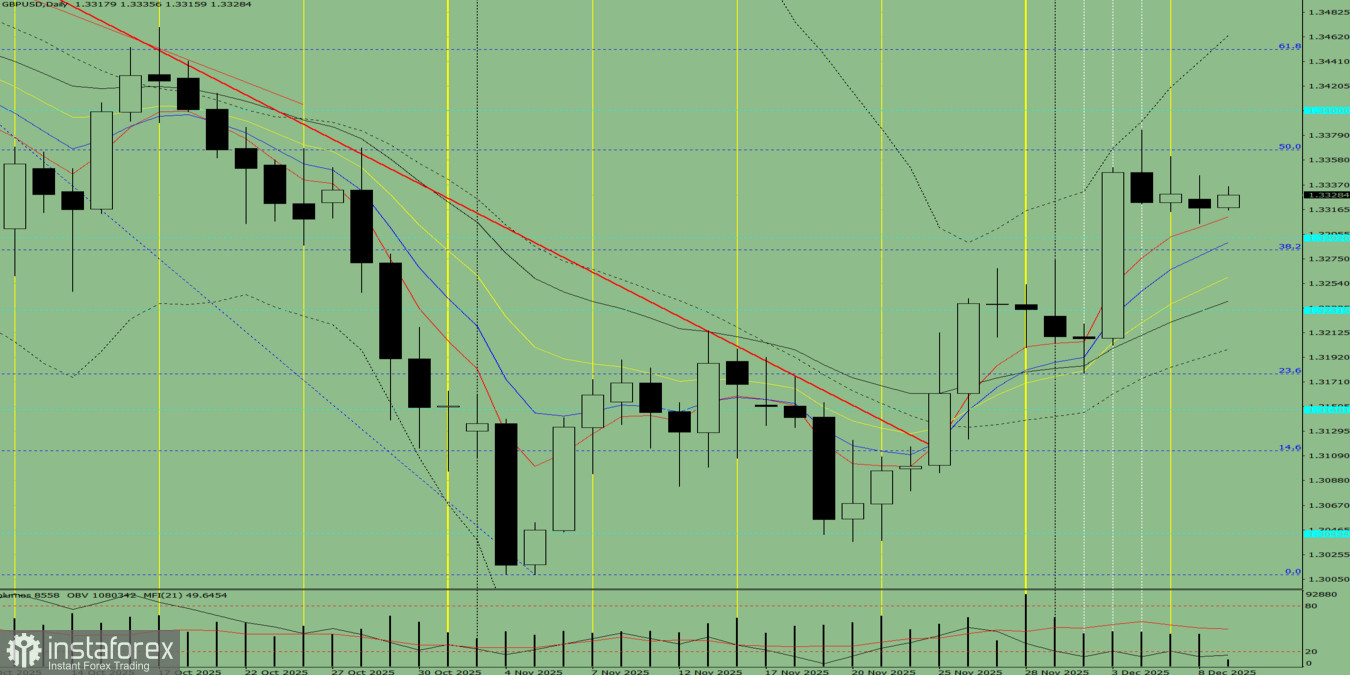
Fig. 1 (Daily Chart)
Comprehensive Analysis:
- Indicator analysis — upward
- Volume — upward
- Candlestick analysis — upward
- Trend analysis — upward
- Bollinger Bands — upward
- Weekly chart — upward
Overall conclusion: upward trend.
Alternative scenario: From the level of 1.3317 (yesterday's daily candle close), the price may begin moving upward toward 1.3345 — the upper fractal (daily candle of December 8, 2025). When testing this level, the price may possibly start moving downward toward 1.3302 — the 5-period EMA (thin red line).


