


Trend Analysis (Fig. 1).
On Wednesday the market, from the 1.3293 level (yesterday's daily candle close), may possibly begin moving upward toward 1.3367 – the 50% retracement level (blue dashed line). When testing this level, the price may pull back downward toward 1.3355 – the upper fractal (daily candle of December 9, 2025).
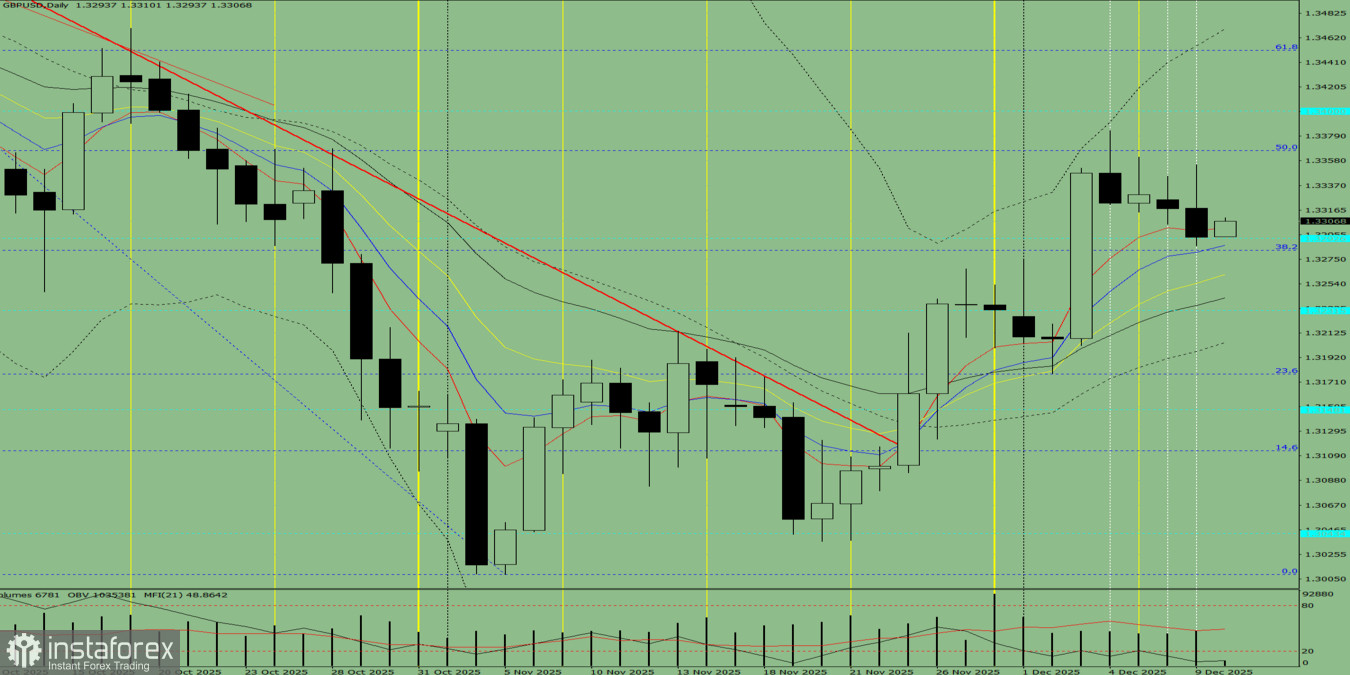
Fig. 1 (daily chart).
Comprehensive Analysis:
- indicator analysis – upward;
- Fibonacci levels – upward;
- volumes – upward;
- candlestick analysis – upward;
- trend analysis – upward;
- Bollinger Bands – upward;
- weekly chart – upward.
Overall conclusion: an upward trend.
Alternative scenario: On Wednesday the market, from the 1.3293 level (yesterday's daily candle close), may possibly begin moving upward toward 1.3355 – the upper fractal (daily candle of December 9, 2025). When testing this level, the price may pull back downward toward 1.3345 – the upper fractal (daily candle of December 8, 2025).


