


Trend Analysis (Fig. 1)
On Thursday, from the level of 1.1694 (yesterday's daily candle close), the market may begin moving downward toward the target of 1.1672 – the 14.6% retracement level (red dotted line). When testing this level, the price may rebound upward toward the target of 1.1717 – the 38.2% retracement level (blue dotted line).
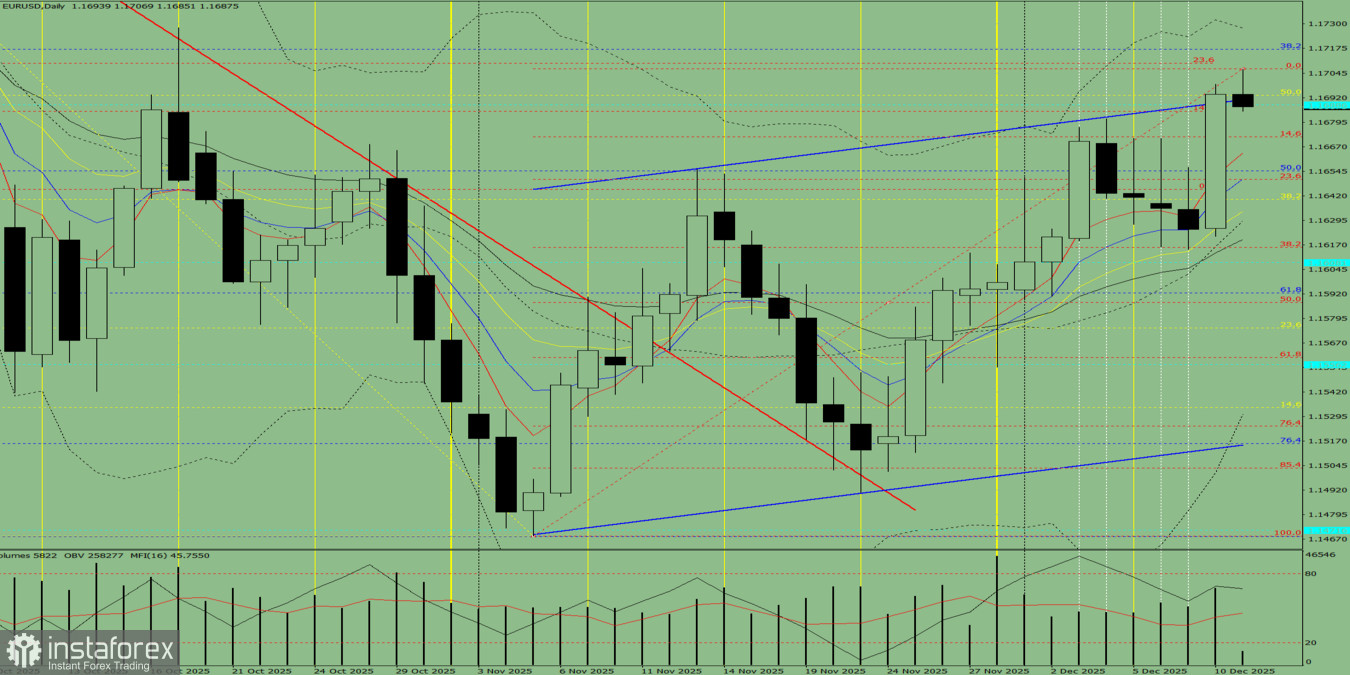
Fig. 1 (Daily Chart)
Comprehensive Analysis:
- Indicator analysis – down
- Fibonacci levels – down
- Volumes – down
- Candlestick analysis – down
- Trend analysis – down
- Bollinger Bands – down
- Weekly chart – down
Overall conclusion: a downward trend.
Alternative Scenario:On Thursday, from the level of 1.1694 (yesterday's daily candle close), the market may begin moving downward toward the target of 1.1664 – the 5-period EMA (thin red line). When testing this line, the price may rebound upward toward the target of 1.1717 – the 38.2% retracement level (blue dotted line).


