


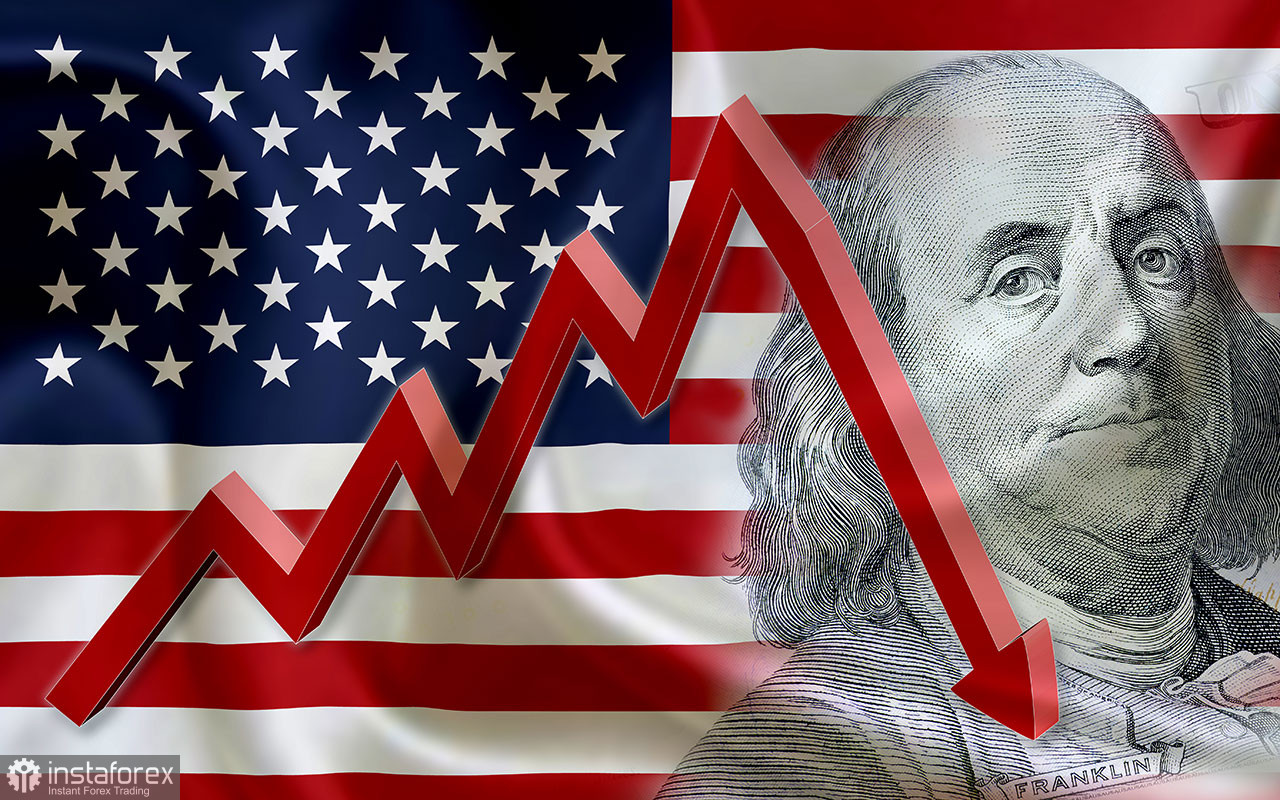
According to the latest report on U.S. GDP for the third quarter, the American economy grew by 4.3%. While this is not the maximum possible figure—since in recent years GDP has shown results of +7% and +5%—it is still a very high value. What accounts for this growth, especially considering that the labor market is "cooling," the unemployment rate is rising, industrial production is declining, and retail sales are stable (not growing)?
Economists report that a significant portion of this growth is due to government spending. Yes, the very spending that Donald Trump promised to reduce as part of a program to lower the national debt. The national debt, which, thanks to the "One Big Beautiful Bill," is expected to increase by $3 trillion over the next 10 years. As the government spends more money, GDP rises, but this increase is not driven by genuine economic growth reflected in consumer demand and its fulfillment. Instead, it is a result of artificial stimulation. Indeed, such growth is still growth, but it explains how the economy can grow even when most of its indicators show disappointing results month after month.
Should we celebrate the 4.3% economic growth? In my opinion, no, and the market rightly reacted little to this report. Alongside it were reports on durable goods orders and industrial production, which painted a very different picture. Orders for automobiles, home appliances, and other expensive goods fell by 2.2% in October, and industrial production decreased by 0.1% in October and increased by only 0.2% in November. Thus, at best, we can speak of stagnation in these indicators.
Given all the above, the American economy could grow by 7% each quarter. However, for market participants, the figure itself—which Trump will later boast about from the podium—is not what matters. What is important to market participants is the real picture of what is happening in the U.S. economy. And here, the situation looks entirely different.
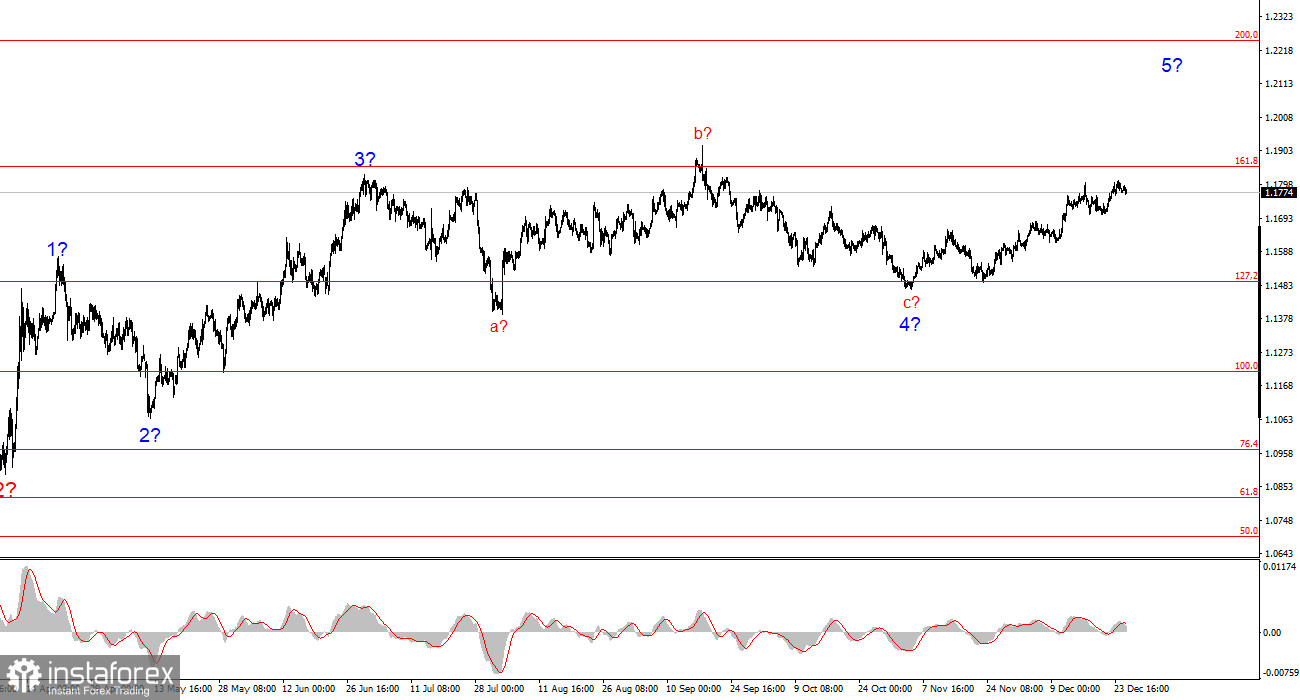
Wave Structure of EUR/USD:
Based on the conducted analysis of EUR/USD, I conclude that the instrument continues to build the bullish segment of the trend. Donald Trump's policies and the Fed's monetary policy remain significant factors in the long-term decline of the American currency. The targets of the current trend segment may stretch up to the 25th figure. The current upward wave pattern is starting to show development, and it is hoped that we are now witnessing the formation of an impulse wave set that is part of the global wave 5. In this case, we should expect growth towards targets around 1.1825 and 1.1926, corresponding to 200.0% and 261.8% on the Fibonacci retracement.
Wave Structure of GBP/USD:
The wave structure of the GBP/USD instrument has changed. The downward corrective structure a-b-c-d-e in C of 4 appears to be complete, as does the entire wave 4. If this is indeed the case, I expect the primary trend segment to resume its development, with initial targets around the 38 and 40 levels.
In the short term, I anticipated the formation of wave 3 or c, with targets around the 1.3280 and 1.3360 marks, corresponding to 76.4% and 61.8% on the Fibonacci retracement. These targets have been reached. Wave 3 or c continues its formation, and currently, a fourth attempt to break the 1.3450 mark (equating to 61.8% on the Fibonacci retracement) is underway. Movement targets are 1.3550 and 1.3720.
Core Principles of My Analysis:
- Wave structures should be simple and understandable. Complex structures are difficult to trade and often require adjustments.
- If there is uncertainty about what is happening in the market, it is better not to enter it.
- There is never 100% certainty in the direction of movement, and there never can be. Don't forget about protective stop-loss orders.
- Wave analysis can be combined with other forms of analysis and trading strategies.


