


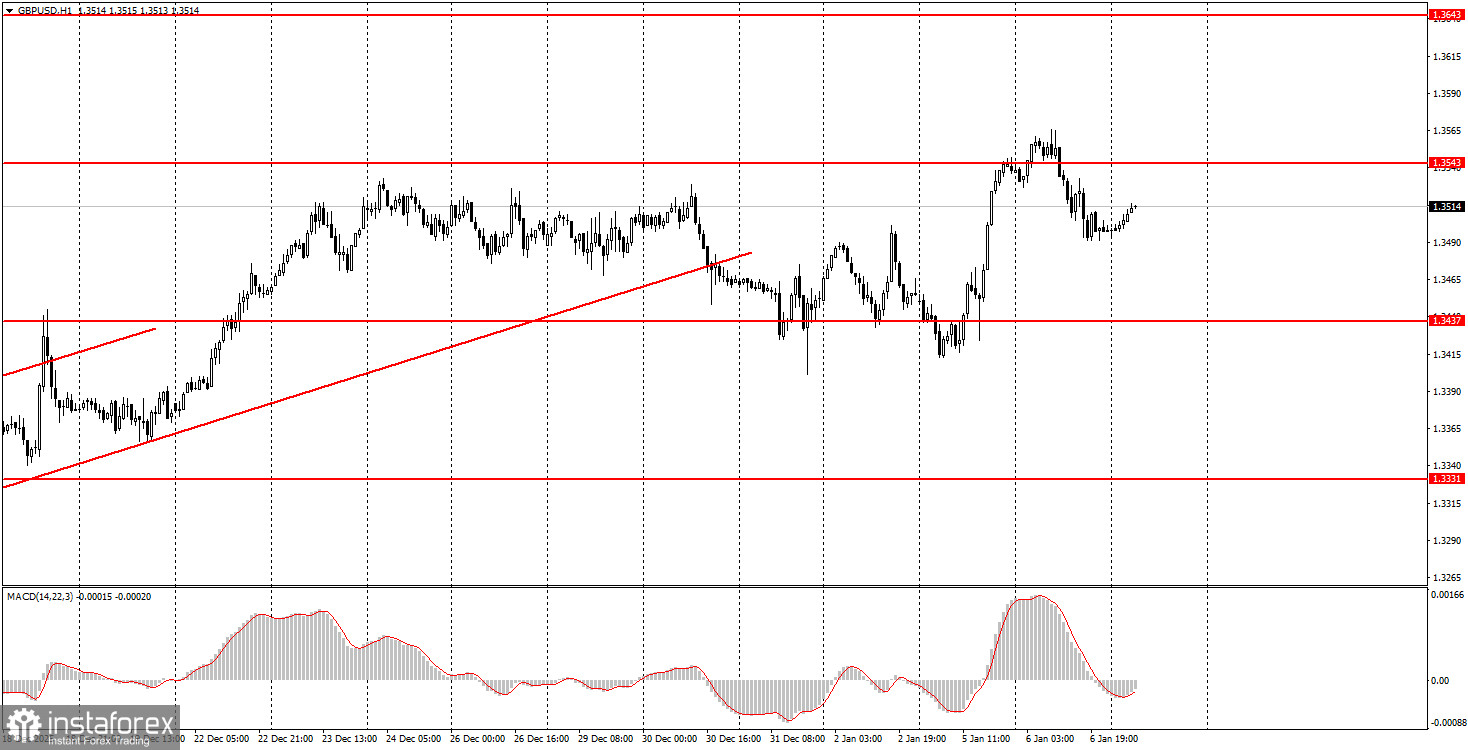
During Tuesday, the GBP/USD pair also showed a slight decline, for which the British currency had no strong reasons. Let us recall that the main factor behind the euro's decline can be considered the German inflation report, which increases the likelihood of a resumption of ECB monetary policy easing in 2026. However, confirmation or denial of this will be obtained today, when December inflation data for the European Union is published. In any case, German inflation has nothing to do with the British pound, so the market simply reacted according to the age-old correlation between the euro and the pound. If one currency falls, we often observe a decline in the other as well. From a technical point of view, an upward trend remains on the hourly timeframe, which is not observed for the EUR/USD pair. However, we do not believe that the euro's downward trend will last long, so we expect a reversal upward and a one-directional move of both the European and British currencies to the upside.
GBP/USD 5M Chart
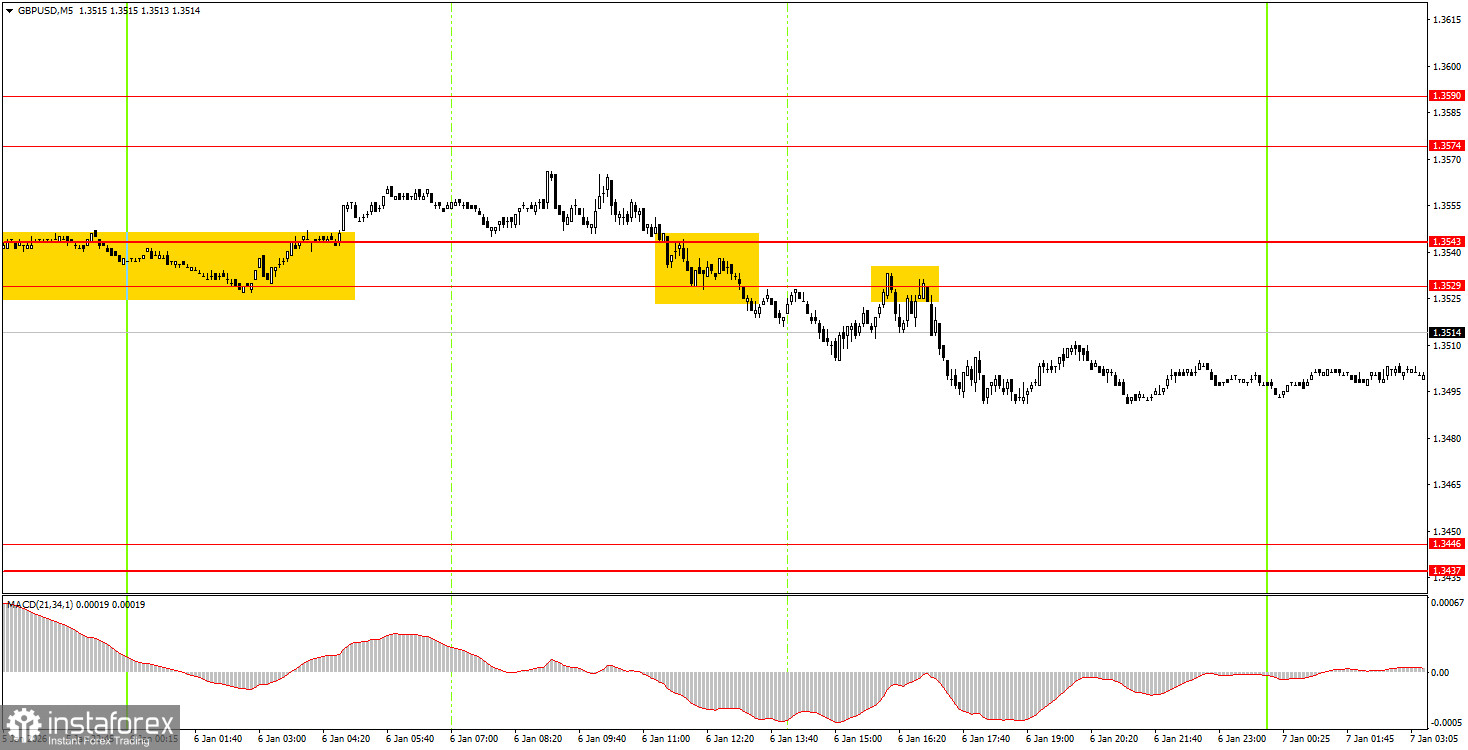
On the 5-minute timeframe, two trading signals were formed on Tuesday. During the European trading session, the pair broke above the 1.3529–1.3543 level, and during the U.S. session it rebounded from the same area from below. Thus, beginner traders had grounds to open short positions. By the end of the day, the pair declined by about 20 points, but the sell trade could easily have been left open with the Stop Loss moved to breakeven.
How to Trade on Wednesday:
On the hourly timeframe, the GBP/USD pair has consolidated below the trend line; however, we see no real downward trend at the moment. There are no global reasons for medium-term growth in the dollar, so we expect movement only to the upside. Overall, we also expect a resumption of the global 2025 uptrend, which could bring the pair to the 1.4000 level within the next couple of months.
On Wednesday, beginner traders may remain in short positions after the two sell signals generated yesterday, targeting the 1.3437–1.3446 level. A new rebound from the 1.3529–1.3543 level would be a reason to open new shorts. A consolidation above the 1.3529–1.3543 level would make long positions relevant with a target of 1.3574–1.3590.
On the 5-minute timeframe, the following levels can currently be traded: 1.3043, 1.3096–1.3107, 1.3203–1.3212, 1.3259–1.3267, 1.3319–1.3331, 1.3437–1.3446, 1.3529–1.3543, 1.3574–1.3590, 1.3643–1.3652, 1.3682, 1.3763. On Wednesday, no notable events are scheduled in the United Kingdom, while in the United States three important reports will be released: the ADP labor market report, the JOLTs job openings report, and the ISM Services PMI.
Basic Rules of the Trading System:
- The strength of a signal is measured by the time required for it to form (a rebound or a breakout of a level). The less time it takes, the stronger the signal.
- If two or more trades were opened near a certain level based on false signals, all subsequent signals from that level should be ignored.
- In a flat market, any pair may generate many false signals or none at all. In any case, at the first signs of a flat, it is better to stop trading.
- Trades are opened during the time period between the start of the European session and the middle of the U.S. session, after which all trades should be closed manually.
- On the hourly timeframe, trades based on MACD signals should preferably be taken only when there is good volatility and a trend confirmed by a trend line or a trend channel.
- If two levels are located too close to each other (from 5 to 20 points), they should be treated as a support or resistance zone.
- After the price moves 20 points in the correct direction, the Stop Loss should be moved to breakeven.
What's on the Chart:
- Support and resistance price levels are levels that serve as targets when opening buy or sell positions. Take Profit levels can be placed near them.
- Red lines are channels or trend lines that show the current trend and indicate the preferred trading direction.
- The MACD indicator (14, 22, 3)—histogram and signal line—is an auxiliary indicator that can also be used as a source of signals.
Important speeches and reports (always listed in the news calendar) can have a very strong impact on currency pair movements. Therefore, during their release, it is recommended to trade with maximum caution or to exit the market to avoid a sharp price reversal against the preceding move.
Beginner forex traders should remember that not every trade can be profitable. Developing a clear strategy and proper money management are the keys to long-term success in trading.


