


Trade Analysis and Tips for Trading the Japanese Yen
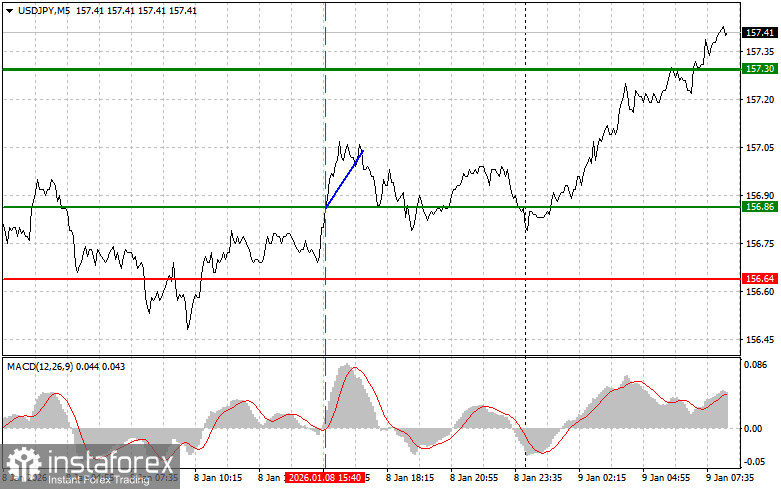
The price test at 156.86 coincided with the moment when the MACD indicator had just started moving upward from the zero line, confirming a correct entry point to buy the dollar. As a result, the pair rose by 20 points.
Better-than-expected U.S. unemployment claims data, along with a positive U.S. trade balance, triggered another rise in the dollar against the yen. Today, good data on the growth of Japan's Leading Economic Index and changes in household spending did not help the yen, which continued to weaken against the dollar. It is clear that market participants are relying on strong U.S. labor market statistics, which could significantly weaken the yen's position against the dollar. In the near term, the dollar's movement will largely depend on incoming macroeconomic data and comments from Federal Reserve officials. For this reason, traders need to carefully analyze these factors to assess USD/JPY prospects.
For intraday strategy, I will mainly rely on Scenario 1 and Scenario 2.
Buy Scenarios
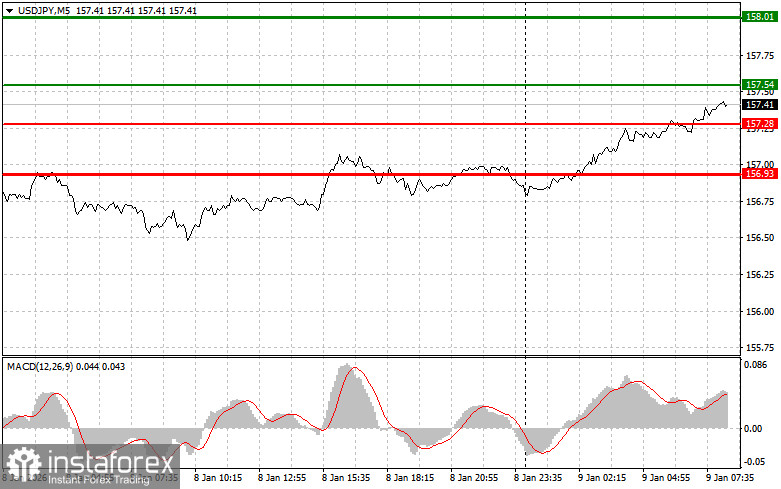
Scenario 1: I plan to buy USD/JPY today around the entry point of 157.54 (green line on the chart) with a target of 158.01 (thicker green line on the chart). Around 158.01, I plan to exit long positions and open short positions in the opposite direction, expecting a 30–35 point move. It is best to return to buying the pair on corrections and significant pullbacks of USD/JPY.
Important: Before buying, make sure the MACD indicator is above the zero line and just starting to rise from it.
Scenario 2: I also plan to buy USD/JPY today if the price tests 157.28 twice in a row while the MACD indicator is in the oversold area. This will limit the downward potential of the pair and trigger a market reversal upward. Growth can be expected toward 157.54 and 158.01.
Sell Scenarios
Scenario 1: I plan to sell USD/JPY today only after the price drops below 157.28 (red line on the chart), which will lead to a rapid decline in the pair. The key target for sellers will be 156.93, where I plan to exit short positions and open long positions in the opposite direction, expecting a 20–25 point move. It is best to sell as high as possible.
Important: Before selling, make sure the MACD indicator is below the zero line and just starting to move downward from it.
Scenario 2: I also plan to sell USD/JPY today if the price tests 157.54 twice in a row while the MACD indicator is in the overbought area. This will limit the pair's upward potential and trigger a market reversal downward. A decline can be expected toward 157.28 and 156.93.
What Is Shown on the Chart
- Thin green line – entry price for buying the instrument.
- Thick green line – approximate price for placing Take Profit or manually taking profit, as further growth above this level is unlikely.
- Thin red line – entry price for selling the instrument.
- Thick red line – approximate price for placing Take Profit or manually taking profit, as further decline below this level is unlikely.
- MACD indicator – when entering the market, pay attention to overbought and oversold zones.
Important Notes for Beginners:
Forex beginners should exercise extreme caution when deciding to enter the market. It is best to stay out of the market before the release of important fundamental reports to avoid sudden price fluctuations. If trading during news releases, always use stop orders to minimize losses. Without stop orders, you can quickly lose your entire deposit, especially if you trade large volumes without proper money management.
Remember, successful trading requires a clear trading plan, like the one outlined above. Making spontaneous trading decisions based on the current market situation is a fundamentally losing strategy for intraday traders.


