


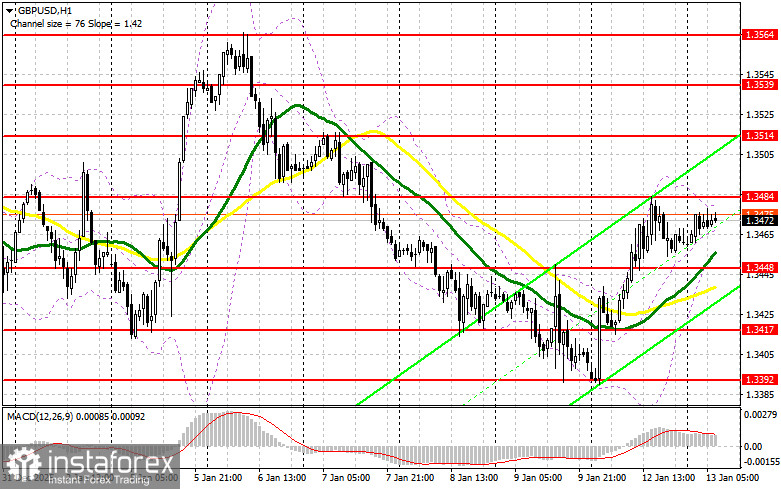
Yesterday, several entry points into the market were formed. Let's look at the 5-minute chart and analyze what happened. In my morning forecast, I highlighted the 1.3460 level and planned to make entry decisions based on it. The rise and formation of a false breakout around 1.3460 provided a sell entry point for the pound, resulting in a drop of about 15 pips. In the second half of the day, active seller actions around 1.3484 allowed entry into short positions, which led to a 30-pip decline.
For opening long positions on GBPUSD, it is required:
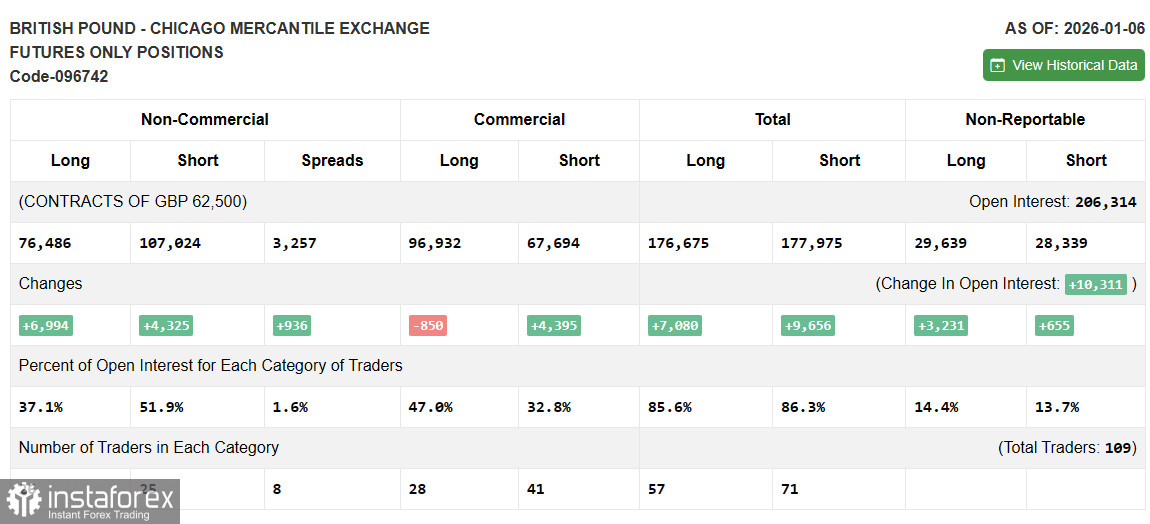
Before dissecting the technical picture of the pound, let's look at what happened in the futures market. In the COT report (Commitment of Traders) for January 6, there was growth in both long and short positions. The probability of rate cuts in the US weakened considerably after the latest US labor market data, but a new risk for the dollar emerged: sharp pressure from the Trump administration on the Fed, which suggests persistent problems for the dollar and short-term growth for the British pound. At the same time, Bank of England policy remains restrained, indicating their clear plans to continue fighting inflation, although this has not given much confidence to pound buyers recently. The latest COT report indicates that non-commercial long positions increased by 6,994 to 76,486, while non-commercial short positions rose by 4,325 to 107,024. As a result, the spread between longs and shorts widened by 936.
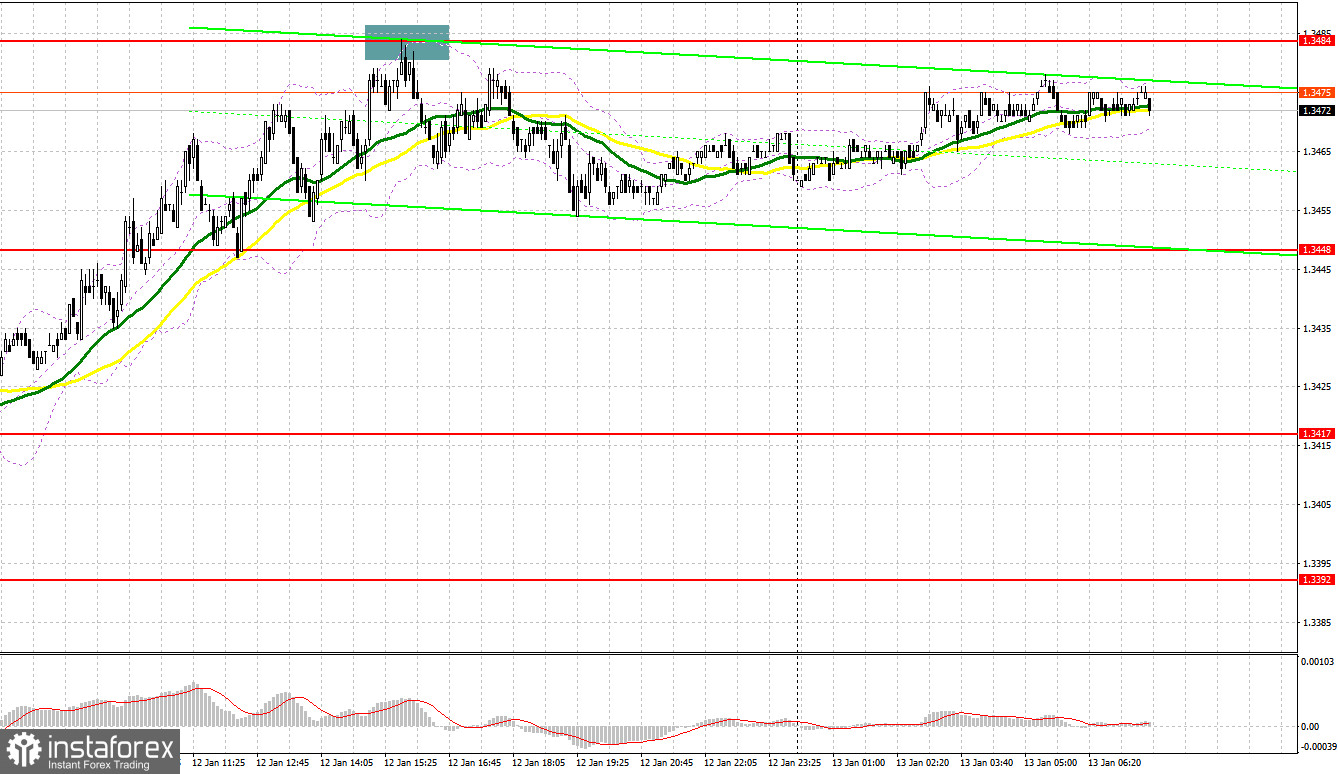
Today, in the first half of the day, a speech by Bank of England Governor Andrew Bailey is expected. His remarks may concern future Bank of England policy, so a spike in GBP/USD volatility is guaranteed. In the case of a dovish stance, the pair may correct, which I plan to use. The formation of a false breakout around the new support at 1.3448 will be a reason to open a long position targeting a return of GBP/USD to resistance at 1.3484, which failed to be overcome yesterday. A breakout and retest of this range will give a chance for further GBP/USD recovery, leading to new long positions and allowing the pair to reach 1.3514. If price moves above that range, a push to 1.3539 can be expected, where I plan to take profit. If GBP/USD falls and there are no buyers around 1.3448, bears will try to force a larger sell-off, which could lead to a decline toward the next support at 1.3417. The formation of a false breakout there would be a suitable entry condition. Opening long positions immediately on a rebound can be done from 1.3392 with a target of a 30–35 pip intraday correction.
For opening short positions on GBPUSD, it is required:
Pressure on the pound did not return yesterday. If the uptrend continues after Bailey's speech, I will only consider shorts in the case of a false breakout at resistance 1.3484. Only that will provide a good short entry targeting a drop to support at 1.3448, where moving averages pass and favor buyers. A breakout and retest of this range from below will increase pressure on the pair, giving bears the advantage and another short entry to target a move toward 1.3417. There, I expect a stronger buyer reaction. The farthest target for bears will be the 1.3392 low, where I will take profit. If GBP/USD rises and bears are absent at 1.3484, the bearish market will be over, and buyers will get a chance for a larger recovery to resistance 1.3514 — I will only sell there on a false breakout. If there is no activity there, I recommend opening short positions from 1.3539, expecting a 30–35 pip intraday rebound downward.
Indicator signals
Moving averages
Trading is taking place above the 30- and 50- day moving averages, indicating possible pound growth.
Note: the period and price basis of the moving averages are considered by the author on the hourly H1 chart and differ from the classical daily moving averages on the D1 chart.
Bollinger Bands
In case of a rise, the upper band will act as resistance around 1.3480. In the event of a decline, the lower band will provide support at around 1.3448.
Indicator descriptions
- Moving average — smooths volatility and noise to determine the current trend. Period — 50. Marked in yellow on the chart.
- Moving average — smooths volatility and noise to determine the current trend. Period — 30. Marked in green on the chart.
- MACD (Moving Average Convergence/Divergence) — fast EMA period 12, slow EMA period 26, signal SMA period 9.
- Bollinger Bands — period 20.
- Non-commercial traders — speculators such as retail traders, hedge funds, and large institutions using the futures market for speculative purposes and meeting certain criteria.
- Non-commercial long positions — the total long open position of non-commercial traders.
- Non-commercial short positions — the total short open position of non-commercial traders.
- Net non-commercial position — the difference between non-commercial long and short positions.


