


Bitcoin continues to decline, pulling down the entire market with it. We continue to expect further declines in both the short term and long term, unlike many experts who continuously predict growth. However, we see no fundamental or technical basis for growth at this time. If growth does begin (which cannot be ruled out entirely), "bullish" patterns, reversal models, and signals will begin to form. In this case, we will certainly start considering the potential for a new upward trend (whether local or global). However, at this moment, there are no grounds for such expectations.
Meanwhile, the cryptocurrency exchange Coinbase conducted a survey among major investors, which found that the vast majority of respondents consider Bitcoin undervalued. Unfortunately, such surveys do not provide insight into why investors hold this opinion. According to Coinbase experts, Bitcoin is lagging behind the performance of gold, silver, and the stock market, and is expected to show new growth in 2026. We do not support this view and see no real correlation between gold/silver/stocks and Bitcoin.
It should be understood that these are fundamentally different assets. Precious metals have always been considered low-risk investments with intrinsic value. Behind any stock lies business, production, jobs, added value, and real assets. Bitcoin has none of that. Since October last year, when Bitcoin set a new record price, 60% of surveyed investors either retained their investments in the first cryptocurrency or increased them. 80% of respondents intend to increase or maintain their investments in Bitcoin. Approximately half of those surveyed believe that Bitcoin is currently in a phase that historically forms a basis for a new trend. It is interesting to note how Coinbase sorted opinions and how large the group of surveyed investors was; if it were only 5 people, then such results could be achieved quite easily...
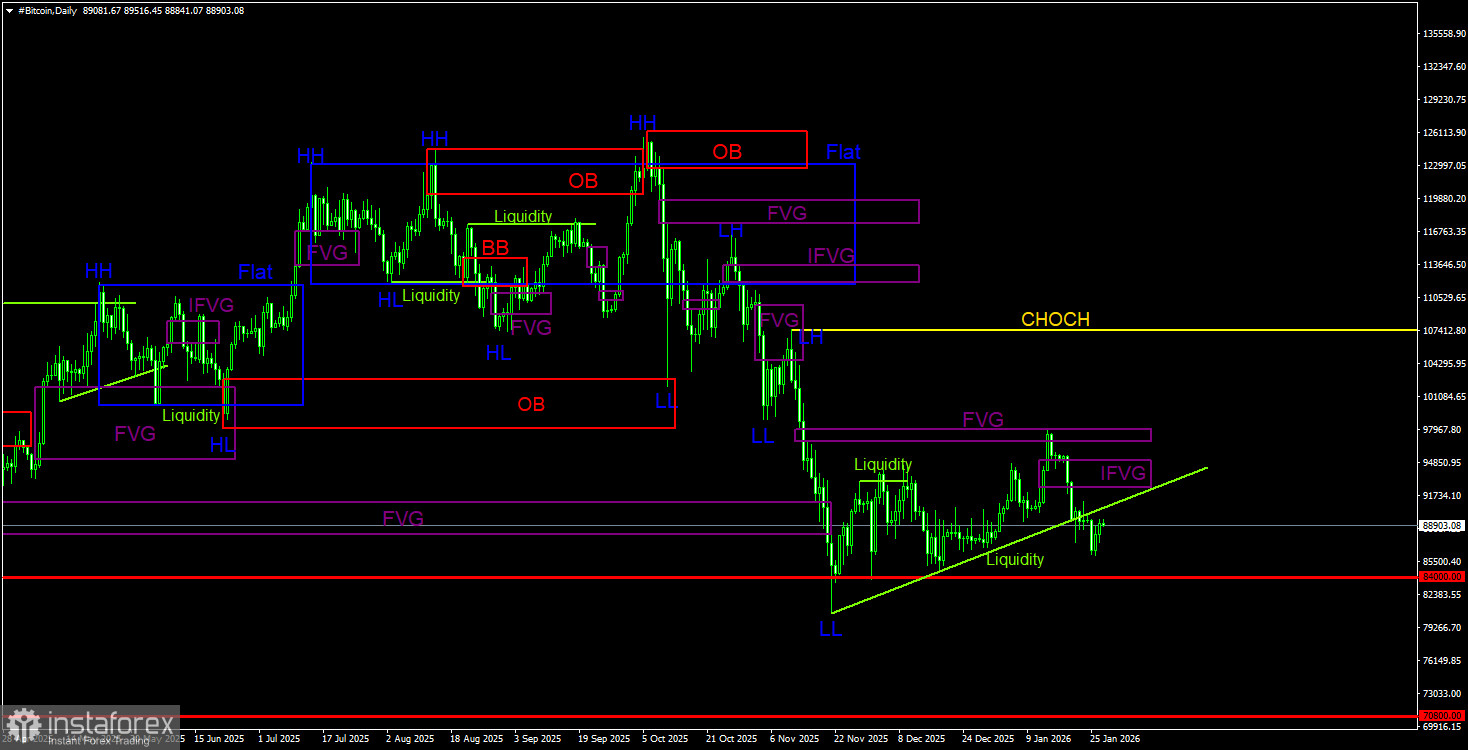
Trading Recommendations for BTC/USD:
Bitcoin continues to form a full-fledged downward trend. In the near future, we expect a decline to $70,800 (the 50.0% Fibonacci level from a three-year upward trend). New areas of interest (POI) for sales on the daily timeframe include the "bearish" IFVG located in the range of $92,500 – $95,000. The price may return to this pattern and then initiate a further decline. On the 4-hour timeframe, there are currently no unaddressed bearish patterns, so new short positions will only be possible in the $92,500–$95,000 range.
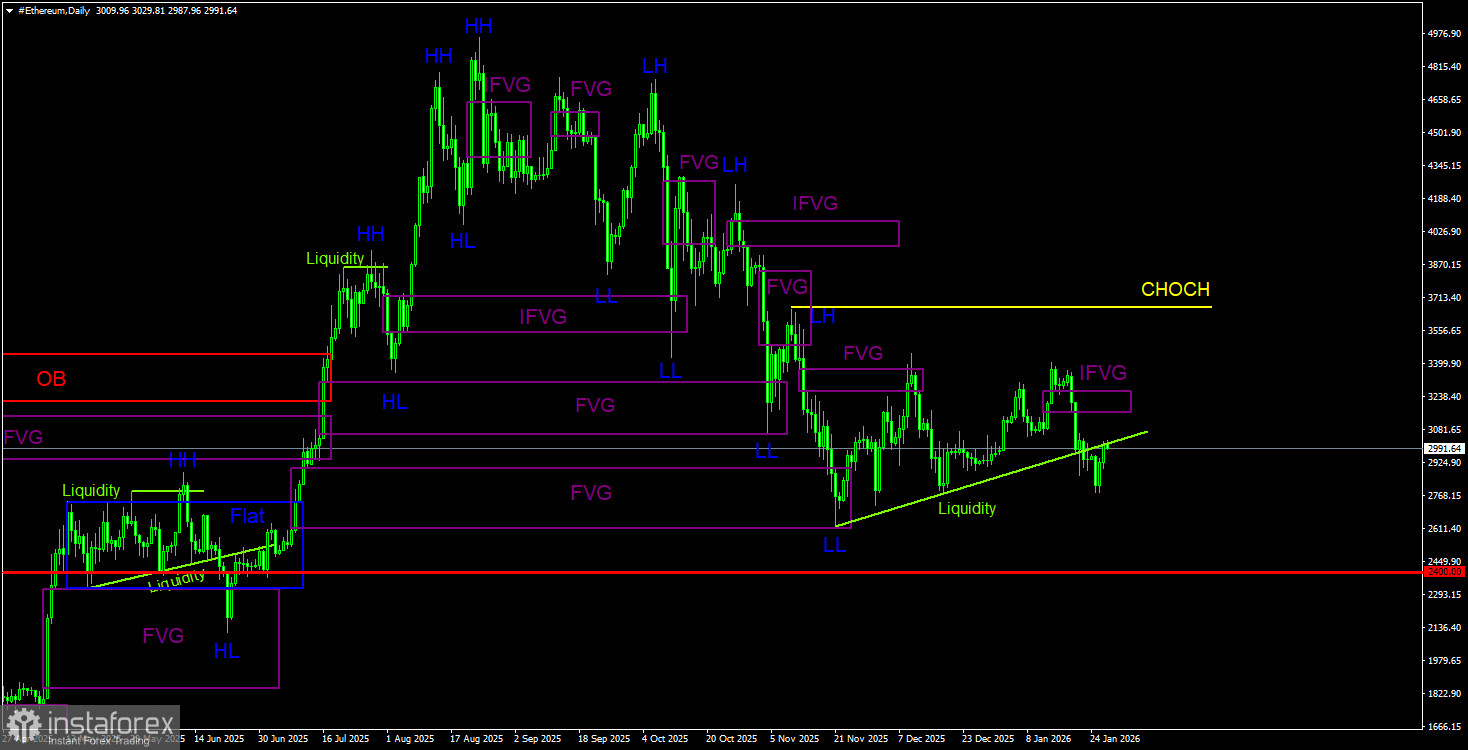
Trading Recommendations for ETH/USD:
On the daily timeframe, a downward trend continues to form. The key selling pattern has been and remains the bearish order block on the weekly timeframe. The movement triggered by this signal should be strong and prolonged. A correction in the cryptocurrency market may conclude soon. On the daily timeframe for Ethereum, there is a bearish IFVG. Traders may consider this pattern for opening new short positions. The target levels for the decline—$2,717 and $2,618—remain relevant. And these are just the closest targets. The potential for Ethereum to fall in the medium term is at least $2,400.
Explanations for the Illustrations:
- CHOCH – change in trend structure.
- Liquidity – Stop Loss orders by traders that market makers use to build their positions.
- FVG – Fair Value Gap. The price passes through such areas very quickly, indicating a complete absence of one side in the market. Subsequently, the price tends to return and react to such areas.
- IFVG – Inverted Fair Value Gap. After returning to such an area, the price does not react to it and pierces it impulsively, then tests it from the other side.
- OB – Order Block. A candle on which the market maker opened a position to grab liquidity for forming their own position in the opposite direction.


