


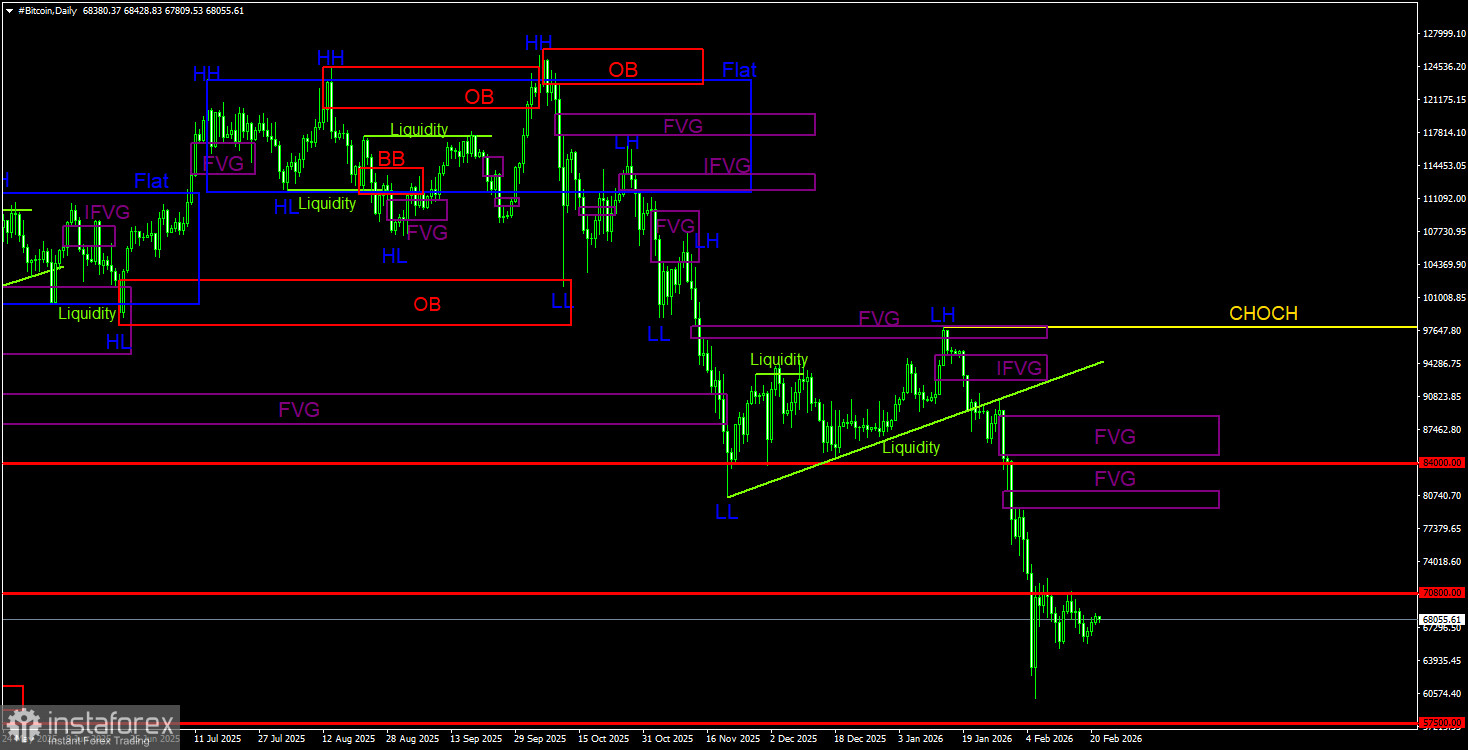
Bitcoin has decreased by more than 50% since October of last year and still shows no signs of recovery. A sideways movement has formed on the 4-hour timeframe at these lower levels. We believe the correction may take quite a while and could be complex, but the downward trend will remain intact. Therefore, we expect Bitcoin to continue its decline, targeting $57,500 and lower.
Analysts at K33 shared their views on Bitcoin's future dynamics. Specifically, Vetle Lunde indicated that Bitcoin may currently be in the late phase of a "bearish" trend, and the current technical picture closely resembles that of 2022. Recall that during that time, Bitcoin traded around $15,000, experiencing prolonged consolidation before entering a lengthy downtrend. The situation indeed resembles 2022; however, it is unwise to make long-term conclusions based solely on this pattern.
In 2021-2022, Bitcoin lost nearly 80% of its value after completing another upward trend; now it has "only" lost 50%. This is the first significant difference. In 2021-2022, the entire "bearish" trend lasted about a year; now, it has only been 5 months. In September-October 2022, US inflation began to slow from its peak, which led the market to expect an easing of the Fed's monetary policy. At that time, the dollar began to depreciate against the euro, the pound, and other currencies, as clearly shown on the charts. Thus, there were strong reasons for a new "bullish" trend for Bitcoin in 2022. What reasons exist now, aside from endless forecasts from various experts about sky-high prices for "digital gold"? This is the third important distinction.
Lunde also mentioned that Bitcoin and its derivatives are showing a cleansing of speculative pressure, meaning that "day traders" are leaving the market. Only long-term and large investors remain in Bitcoin. This statement is also quite debatable, considering the massive sell-offs of Bitcoin by large funds and even exchanges in recent months. Only MicroStrategy continues to hold Bitcoin, as selling the cryptocurrency would crash its stock and lead to a complete loss of trust in Michael Saylor's model.
Trading Recommendations for BTC/USD:
Bitcoin continues to develop a full downward trend. We expect the decline to continue, targeting $57,500 (the 61.8% Fibonacci of the three-year upward trend), and there are currently no signs of a trend reversal. Even the $57,500 level no longer seems like a terminal stop. Within the POI areas for selling on the daily timeframe, the last "bearish" FVG can be noted, which is still quite far for Bitcoin. On the 4-hour timeframe, there are three unaddressed bearish FVGs; however, these patterns occurred in previous movements and are located well above the current price. They are unlikely to provoke a resumption of the trend.
Trading Recommendations for ETH/USD:
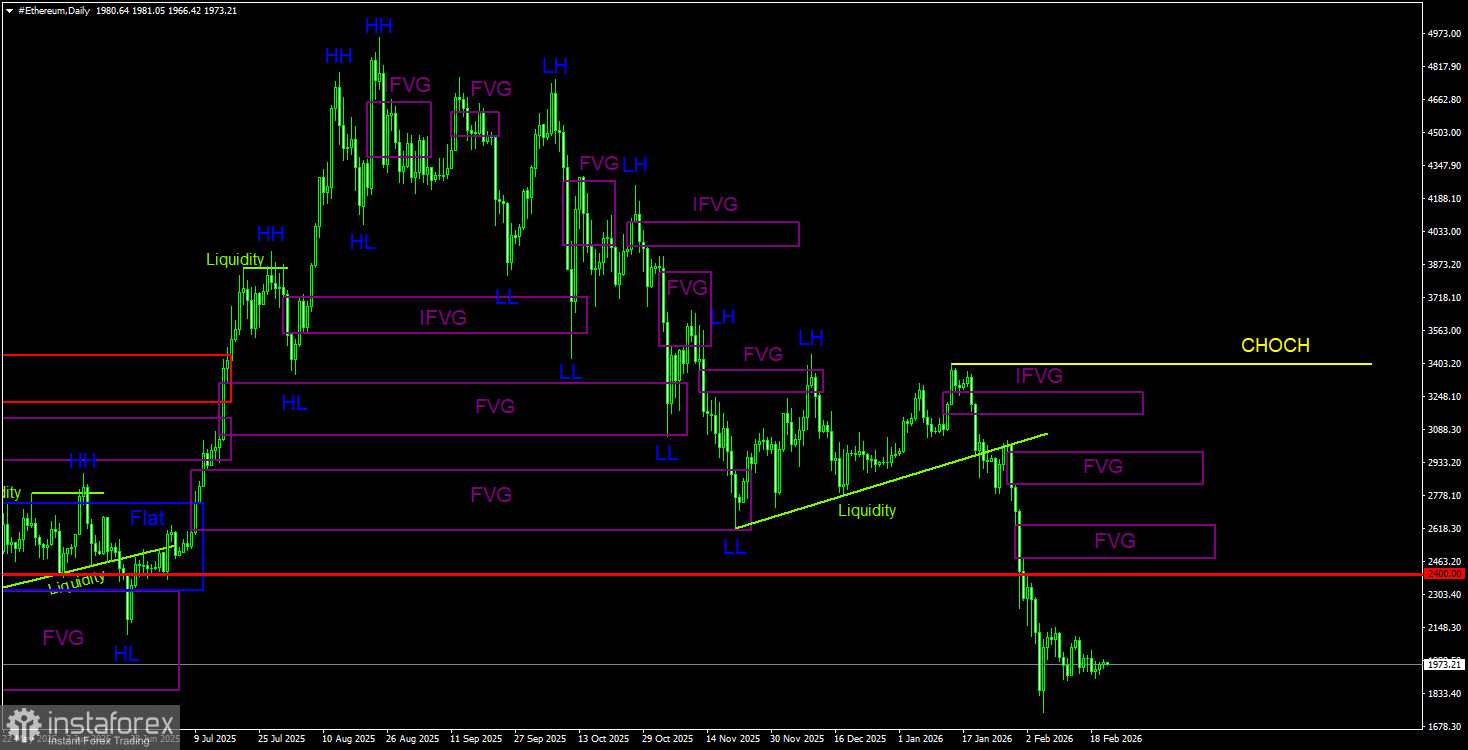
On the daily timeframe, a downward trend continues to develop. A key selling pattern is the bearish order block on the weekly timeframe. As we have warned, the movement triggered by this signal can be strong and prolonged. After its formation, Ethereum has already decreased by 55% or $2,500. In the near term, an upward correction is expected; however, the price is now positioned in a fairly narrow sideways channel. In the short term, Ethereum, like Bitcoin, can be traded only based on deviations at the boundaries of the sideways channel on the 4-hour timeframe.
Explanations for Illustrations:
- CHOCH: Change of character in trend structure.
- Liquidity: Stop-loss orders from traders that market makers use to build their positions.
- FVG: Fair Value Gap - an area of price inefficiency. The price moves through these areas very quickly, indicating a complete absence of one side in the market. Subsequently, the price tends to return and react to these areas.
- IFVG: Inverted Fair Value Gap - after returning to this area, the price does not react to it and breaks through impulsively, then tests it from the other side.
- OB: Order Block - the candle on which the market maker opened a position to gather liquidity for forming their position in the opposite direction.


