


Analysis of Macroeconomic Reports:
There are very few macroeconomic reports scheduled for Thursday. Therefore, traders will have virtually nothing to react to today, and all major currency pairs may continue to trade purely on geopolitical factors. Recall that this factor has no clear deadlines. We always say that the reaction to a Fed meeting can last up to 24 hours, so there is no need to rush to conclusions immediately after the meeting. In the case of geopolitics, the reaction can continue as long as investors keep fleeing from risk assets, and this process could take a long time. Among the interesting reports for Thursday, we can highlight retail sales in the Eurozone and unemployment claims in the US. However, these are interesting rather than crucial reports.
Analysis of Fundamental Events:
General Conclusions:
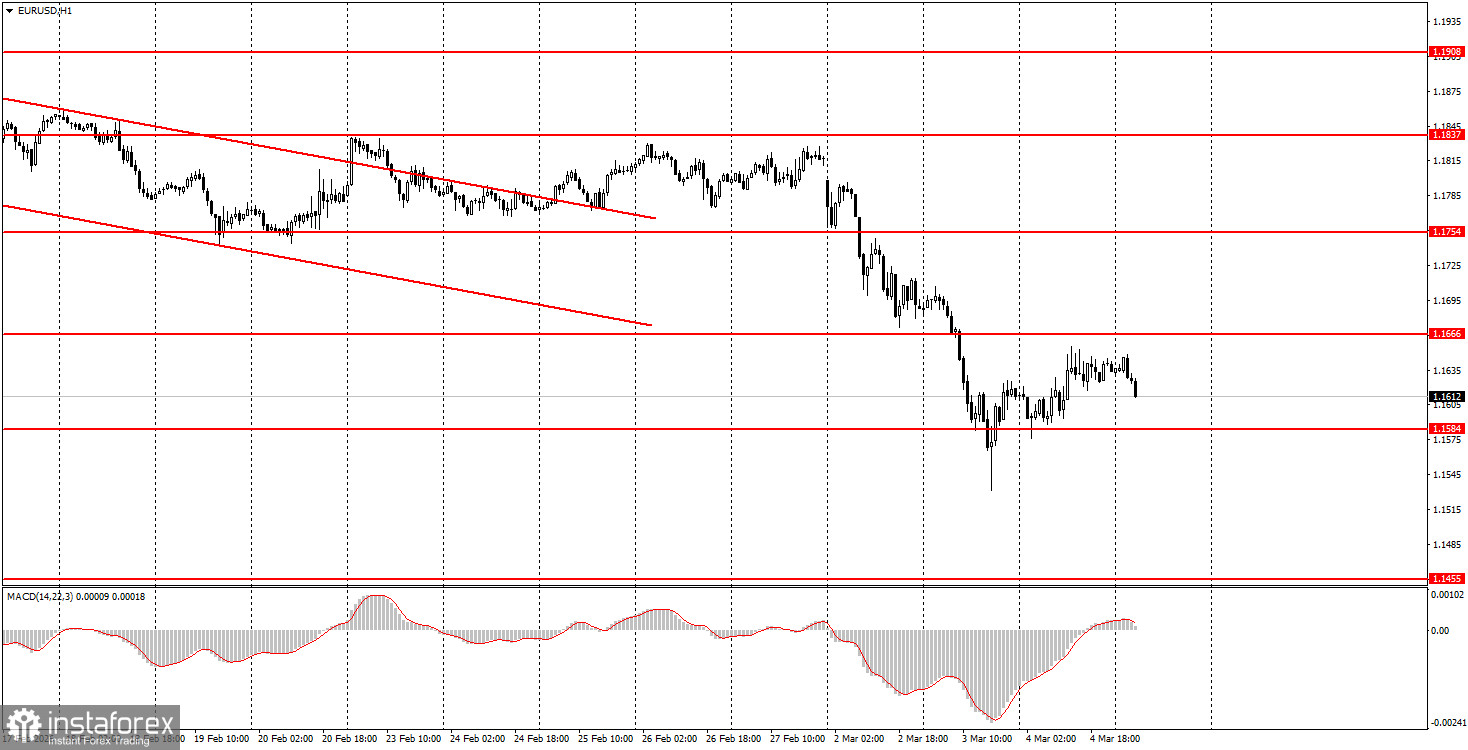
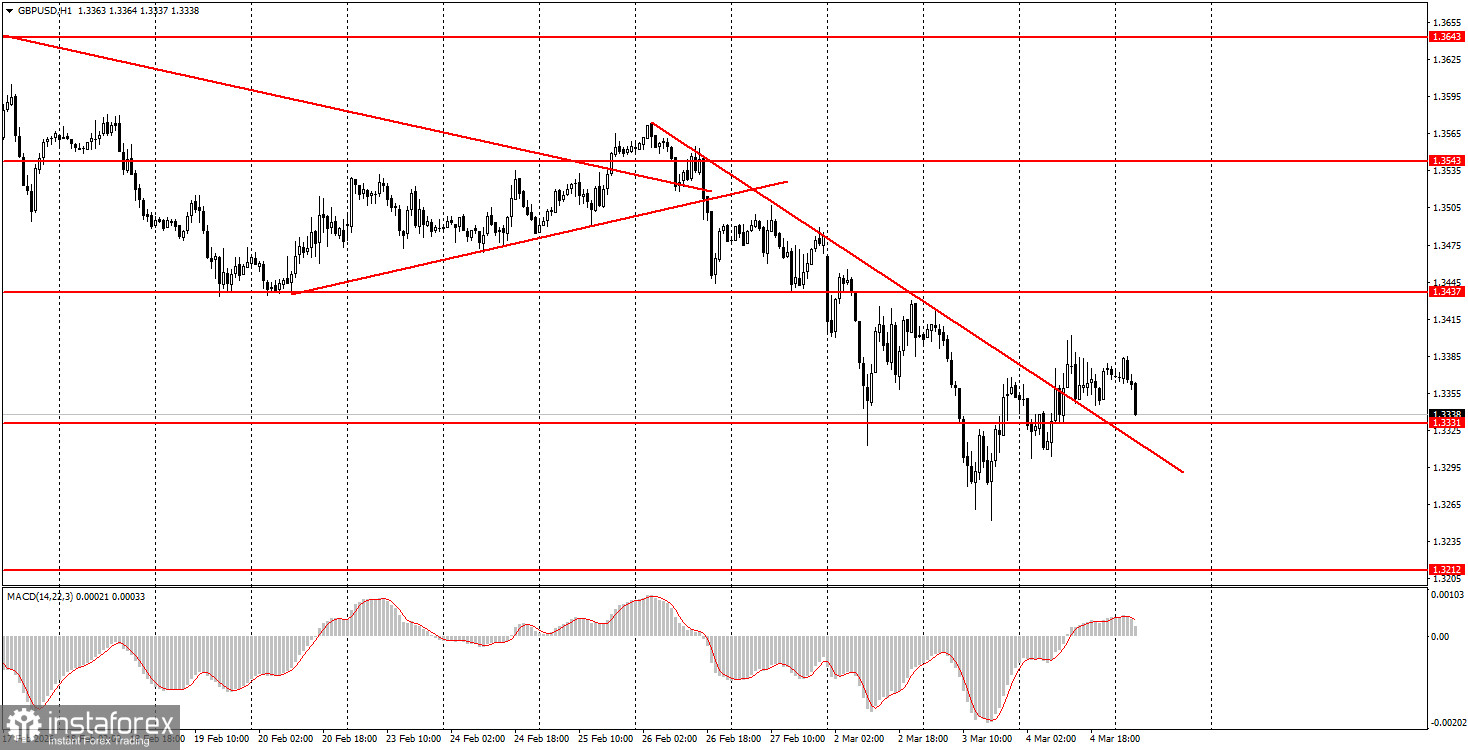
On the penultimate trading day of the week, the market may experience any movement, as events in the Middle East may continue to shake it. The euro can be traded today in the range of 1.1584-1.1591, while the British pound can be traded in the range of 1.3319-1.3331. We still see no grounds for a strong and prolonged rise of the US currency; however, the war in the Middle East may further drag both pairs down.
Key Principles of the Trading System:
- The strength of a signal is determined by the time it takes to form the signal (bounce or breakout). The less time taken, the stronger the signal.
- If two or more trades have been opened at a particular level based on false signals, all subsequent signals from that level should be ignored.
- In a flat market, any pair can form many false signals or none at all. In any case, at the first signs of a flat trend, it is best to stop trading.
- Trading deals are to be opened during the period between the start of the European session and the mid-American session, after which all trades should be closed manually.
- On the hourly timeframe, it is preferable to trade based on signals from the MACD indicator only when there is good volatility and a trend confirmed by a trend line or trend channel.
- If two levels are positioned too close together (5-20 pips apart), they should be considered a support or resistance area.
- Upon moving 15-20 pips in the correct direction, a Stop Loss should be set to breakeven.
What to Look for on the Charts:
Price levels of support and resistance are levels that serve as targets when opening buys or sells. Take Profit levels can be placed around them.
Red lines represent channels or trend lines that show the current trend and indicate the direction in which it is preferable to trade now.
The MACD indicator (14,22,3) – the histogram and the signal line – is a supporting indicator that can also be used as a source of signals.
Important speeches and reports (always included in the news calendar) can significantly affect the movement of the currency pair. Therefore, during their release, trading should be done with utmost caution, or traders should exit the market to avoid sharp price reversals against the previous movement.
Beginning traders in the forex market should remember that not every trade can be profitable. Developing a clear strategy and effective money management are the keys to long-term trading success.


