


Monday's Trade Analysis:
1H Chart of the GBP/USD Pair
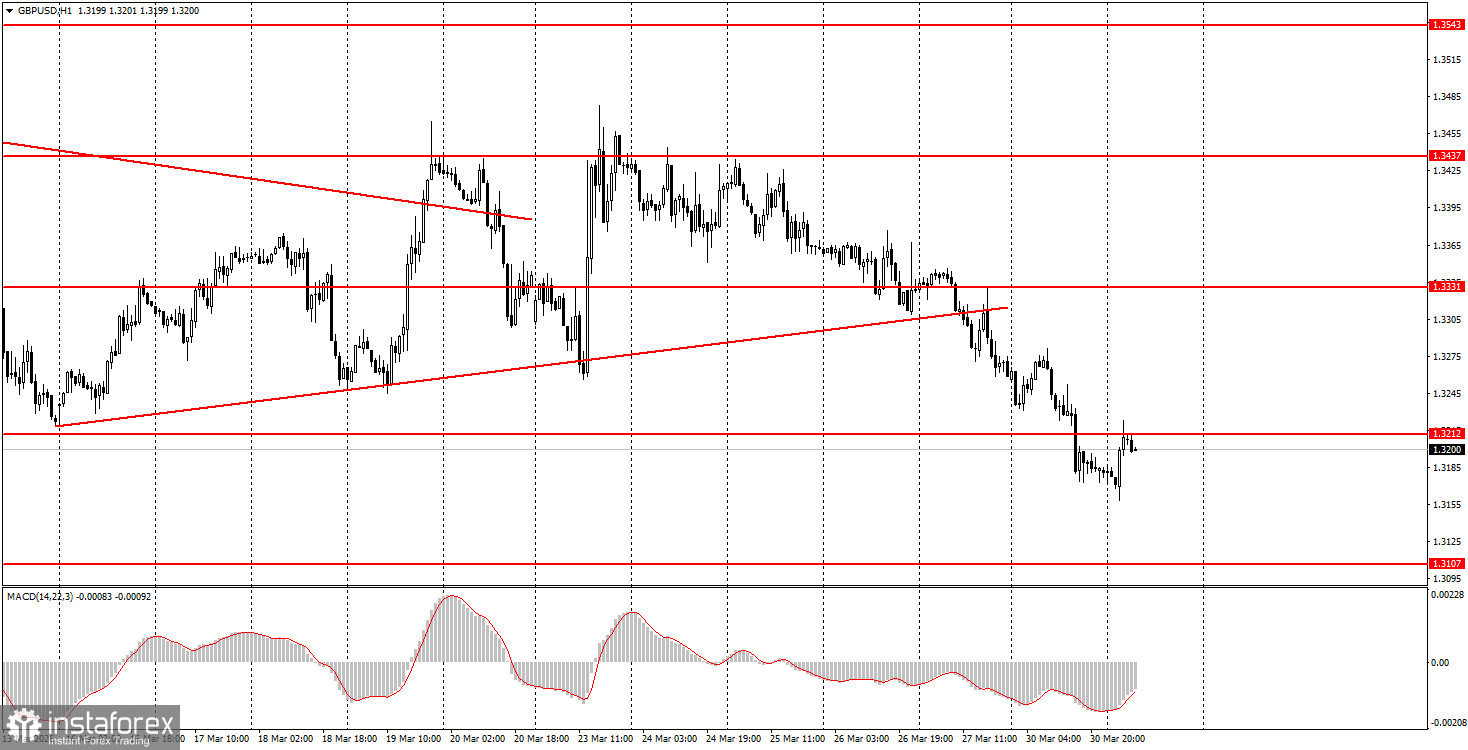
The GBP/USD pair also demonstrated a downward movement on Monday. The macroeconomic backdrop was absent on this day; therefore, the latest drop in the pair could have been triggered by new statements from Donald Trump or even by their absence, because the market currently requires no compelling reasons to buy dollars. Traders are anticipating a US attack on Kharg Island, through which 90% of Iranian oil exports pass, waiting for the closure of the Bab-al-Mandab Strait, expecting anything but a ceasefire. Thus, it is not surprising that the dollar continues to steadily gain value while the market largely ignores other factors. Technically, the ascending trend line was breached last Friday, so the current decline is entirely justified. The problem is that we still have not seen a significant upward trend in the British pound. Despite the Bank of England's readiness to raise the key rate next month, macroeconomic data from across the ocean remain very weak.
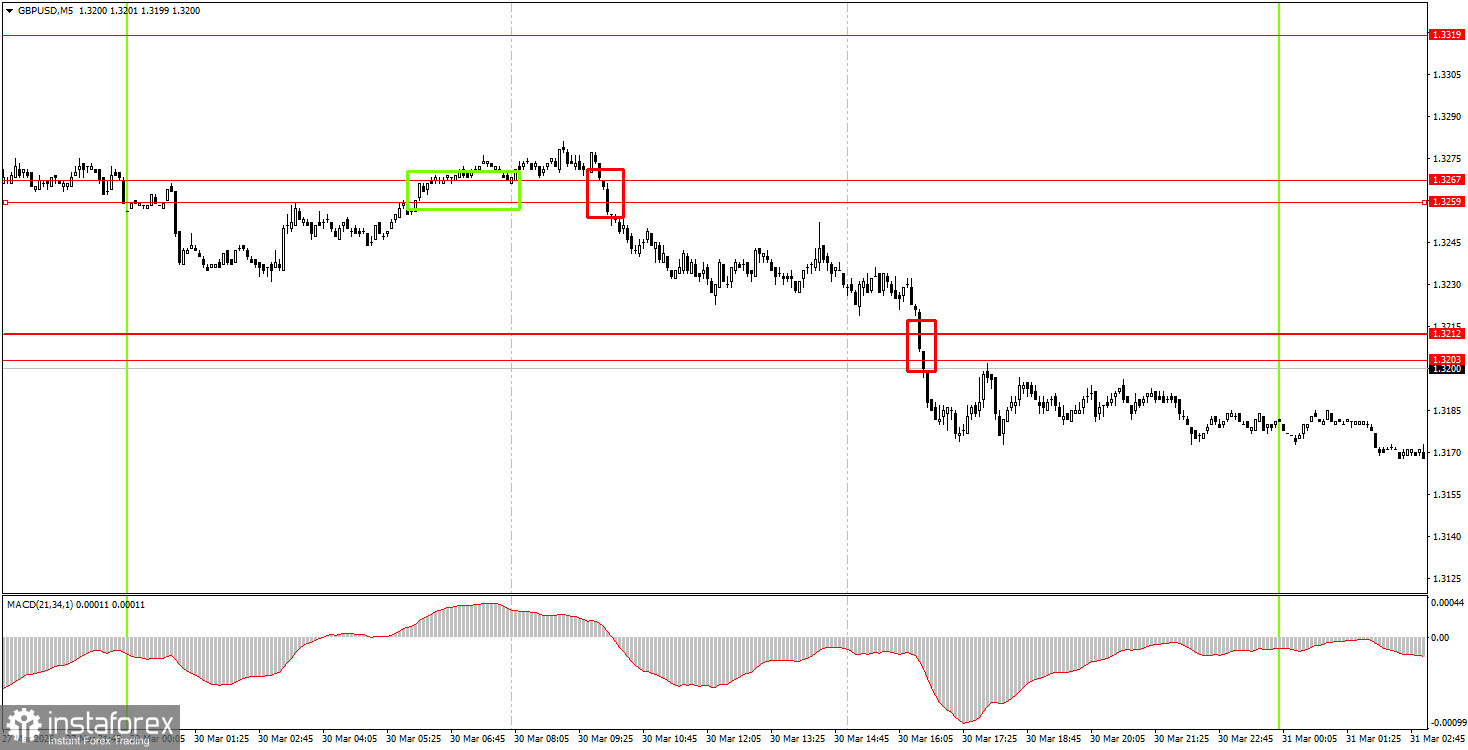
5M Chart of the GBP/USD Pair
How to Trade on Tuesday:
On the hourly timeframe, the latest upward trend for the GBP/USD pair has been broken. There are no global reasons for a medium-term rise in the dollar; therefore, we expect the global upward trend to resume in 2026. However, for this to happen, global geopolitical tensions need to start easing, because right now the dollar is in demand solely on that basis.
On Tuesday, novice traders may consider opening short positions if there is a bounce from the 1.3203-1.3212 area, targeting 1.3096-1.3107. A consolidation above the area of 1.3203-1.3212 will allow for opening long positions with a target of 1.3259-1.3267.
On the 5-minute timeframe, trading can now be based on the levels of 1.3096-1.3107, 1.3203-1.3212, 1.3259-1.3267, 1.3319-1.3331, 1.3403-1.3407, 1.3437-1.3446, 1.3484-1.3489, 1.3529-1.3543, 1.3643-1.3652, 1.3695, and 1.3741-1.3751. Today, the UK will release its third GDP estimate for the fourth quarter, while the US will publish the JOLTs report on job openings. Despite the significance of these reports, the market may well ignore them. And they certainly will not affect the overall trend.
Key Principles of the Trading System:
- The strength of a signal is determined by the time it takes to form the signal (bounce or breakout). The less time taken, the stronger the signal.
- If two or more trades have been opened at a particular level based on false signals, all subsequent signals from that level should be ignored.
- In a flat market, any pair can form many false signals or none at all. In any case, at the first signs of a flat trend, it is best to stop trading.
- Trading deals are to be opened during the period between the start of the European session and the mid-American session, after which all trades should be closed manually.
- On the hourly timeframe, it is preferable to trade based on signals from the MACD indicator only when there is good volatility and a trend confirmed by a trend line or trend channel.
- If two levels are positioned too close together (5-20 pips apart), they should be considered a support or resistance area.
- Upon moving 20 pips in the correct direction, a Stop Loss should be set to breakeven.
What to Look for on the Charts:
Price levels of support and resistance are levels that serve as targets when opening buys or sells. Take Profit levels can be placed around them.
Red lines represent channels or trend lines that show the current trend and indicate the direction in which it is preferable to trade now.
The MACD indicator (14,22,3) – the histogram and the signal line – is a supporting indicator that can also be used as a source of signals.
Important speeches and reports (always included in the news calendar) can significantly affect the movement of the currency pair. Therefore, during their release, trading should be done with utmost caution, or traders should exit the market to avoid sharp price reversals against the previous movement.
Beginning traders in the forex market should remember that not every trade can be profitable. Developing a clear strategy and effective money management are the keys to long-term trading success.


