


The situation in the cryptocurrency market has not changed for a month and a half. On the daily timeframe, it remains the same sluggish and weak upward correction, while on the 4-hour timeframe, it is about 80% in a range with a minimal upward bias. Thus, there is currently no clear range, and there is no trending movement, which further complicates the trading process. After Bitcoin left the sideways channel, we considered the range canceled because the price's deviation above the channel was too strong. However, the recent movements in "digital gold" show that the range is still ongoing. To be honest, the latest moves resemble not even a range, but absolute randomness similar to what we observe in the currency market. The price is being tossed back and forth, and traders cannot decide what to do next. Partly, this is due to geopolitics.
At this time, Bitcoin is falling again, as Donald Trump stated last night that the military operation in Iran could last another 2-3 weeks, and Washington intends to return Iran to the Stone Age, but at the same time, "the war will be over soon." Let's recall how Donald Trump promised to end the war in Ukraine in 24 hours, and we understand that "soon" could mean a couple of years.
Meanwhile, Bitcoin continues to drop below the trendline on the daily timeframe. Recall that the trendline is a liquidity line that the price seeks in almost all cases. Below remains the unfulfilled target of $57,500, where we expect "digital gold," which "could be worth $1 million" in a couple of years, to reach soon.
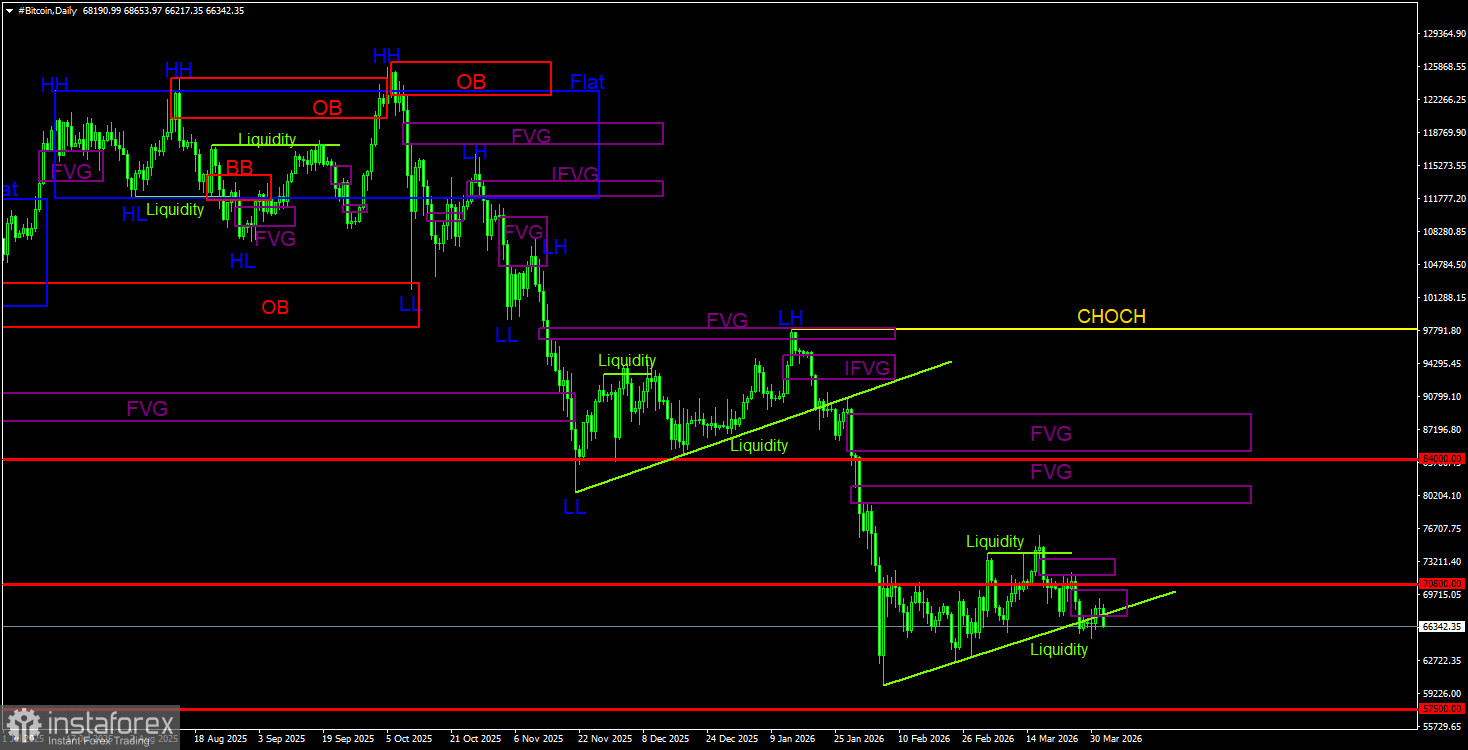
Overall Picture Of BTC/USD On 1D
On the daily timeframe, Bitcoin continues to form a downward trend. The trend structure is identified as descending, and the CHOCH line remains at $97,900. Only above this level can it be considered that the downward trend has ended. The last sell signal was formed within the "bearish" FVG ($96,900 - $98,000). Thus, traders had an excellent opportunity to capture almost all the recent downward movement. Now, we just have to wait. Given no signs of a trend reversal to the upside, we believe the decline will resume. On the daily timeframe, the nearest area of POI for new sell trades is in the range of $79,500 - $81,100. During the current decline, two bearish FVGs have already formed, with prior liquidity used for sales. A new sell signal is currently forming.
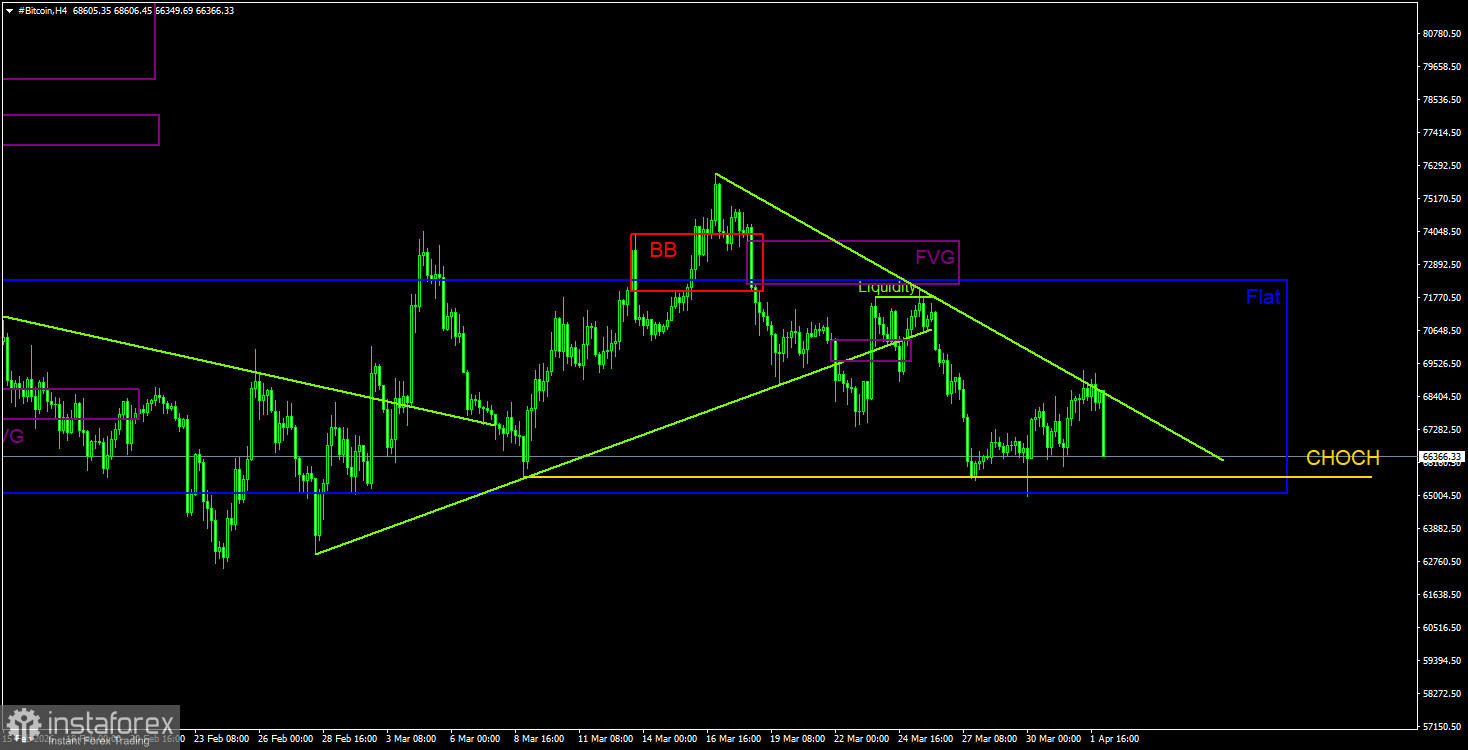
Overall Picture Of BTC/USD On 4H.
On the 4-hour timeframe, the price has dropped to the lower boundary of the sideways channel, formed a deviation/bounce from it, and may now aim upward again. The CHOCH line, which serves as the support for the upward correction, lies at the level of $65,500 and has not been broken. This means the correction continues. Breaching this line will mark the end of a month-and-a-half-long correction. In the last round of decline, two new bearish FVGs formed, but if the range persists, the internal patterns lack significant meaning. We currently trust the daily chart more.
Trading Recommendations For BTC/USD:
Bitcoin continues to form a full-fledged downward trend. We continue to expect a decline, targeting $57,500 (the 61.8% Fibonacci level of the three-year upward trend), and there are currently no signs of a trend reversal. However, even the $57,500 level no longer appears as a final stop. From the POI areas, we can currently identify only the nearest bearish FVG on the daily timeframe, where a signal could form in the coming hours. On the 4-hour timeframe, the movement of Bitcoin again displays all the signs of a range, so we should only monitor deviations at the boundaries of the sideways channel.
Explanations For Illustrations:
CHOCH – Break of trend structure.
Liquidity – Liquidity, Stop Losses of traders, which market makers use to build their positions.
FVG – Fair Value Gap. The price moves through such areas very quickly, indicating a complete absence of one side in the market. Subsequently, the price tends to return and react to such areas.
IFVG – Inverted Fair Value Gap. After returning to such an area, the price does not react and impulsively breaks through it, then tests it from the other side.
OB – Order Block. The candle on which the market maker opened a position with the aim of capturing liquidity to form their own position in the opposite direction.


