


The S&P 500 experienced roller-coaster moves after Donald Trump first threatened to destroy an entire civilization and then announced a two-week ceasefire between the United States and Iran. Investors largely ignored ongoing strikes by Tehran across the Middle East and Israeli actions in Lebanon, which has sheltered Hezbollah. Fighting continues, but hopes for peace have shifted the equity market mood from Fear to Greed.
A modest 4% drop in the S&P 500 during the Middle East conflict looks unusual. Rising geopolitical risk and surging oil prices threatened to materially slow both global and US economic growth. Yet investors clung to the belief the outcome would be positive. Wall Street analysts contributed to the optimism: during the US-Iran standoff, they upgraded earnings forecasts for 131 companies, left estimates unchanged for 266, and cut forecasts for only 103 issuers.
Risk premium dynamics
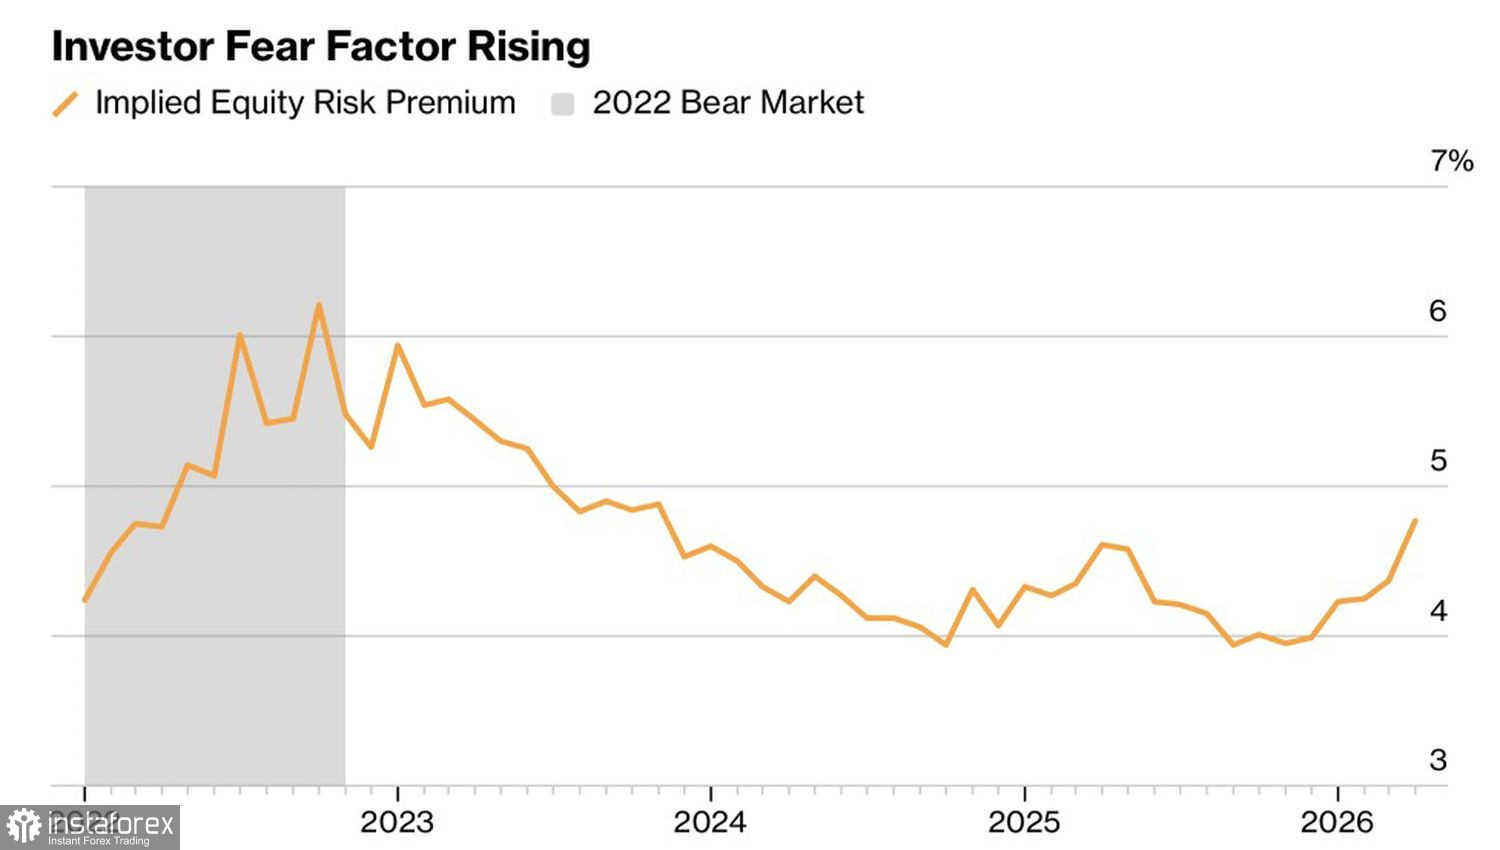
Perhaps the market simply needed time to recognize the potential for a 1970s-style scenario — an oil shock that unleashes inflation, while political pressure keeps the Fed from tightening, producing a double recession. The risk premium on equities versus bonds has jumped to a two-year high, reflecting those fears.
Despite talks between the US and Iran late in the week into April 10, the parties remain far apart. The S&P 500's heightened sensitivity to geopolitical headlines underscores the rocky path up for the broad index. Tehran wants to retain control of the Strait of Hormuz; Washington intends to reclaim transit revenue, arguing the victor should take the spoils, in Trump's words.
Dynamics of implied Fed policy change
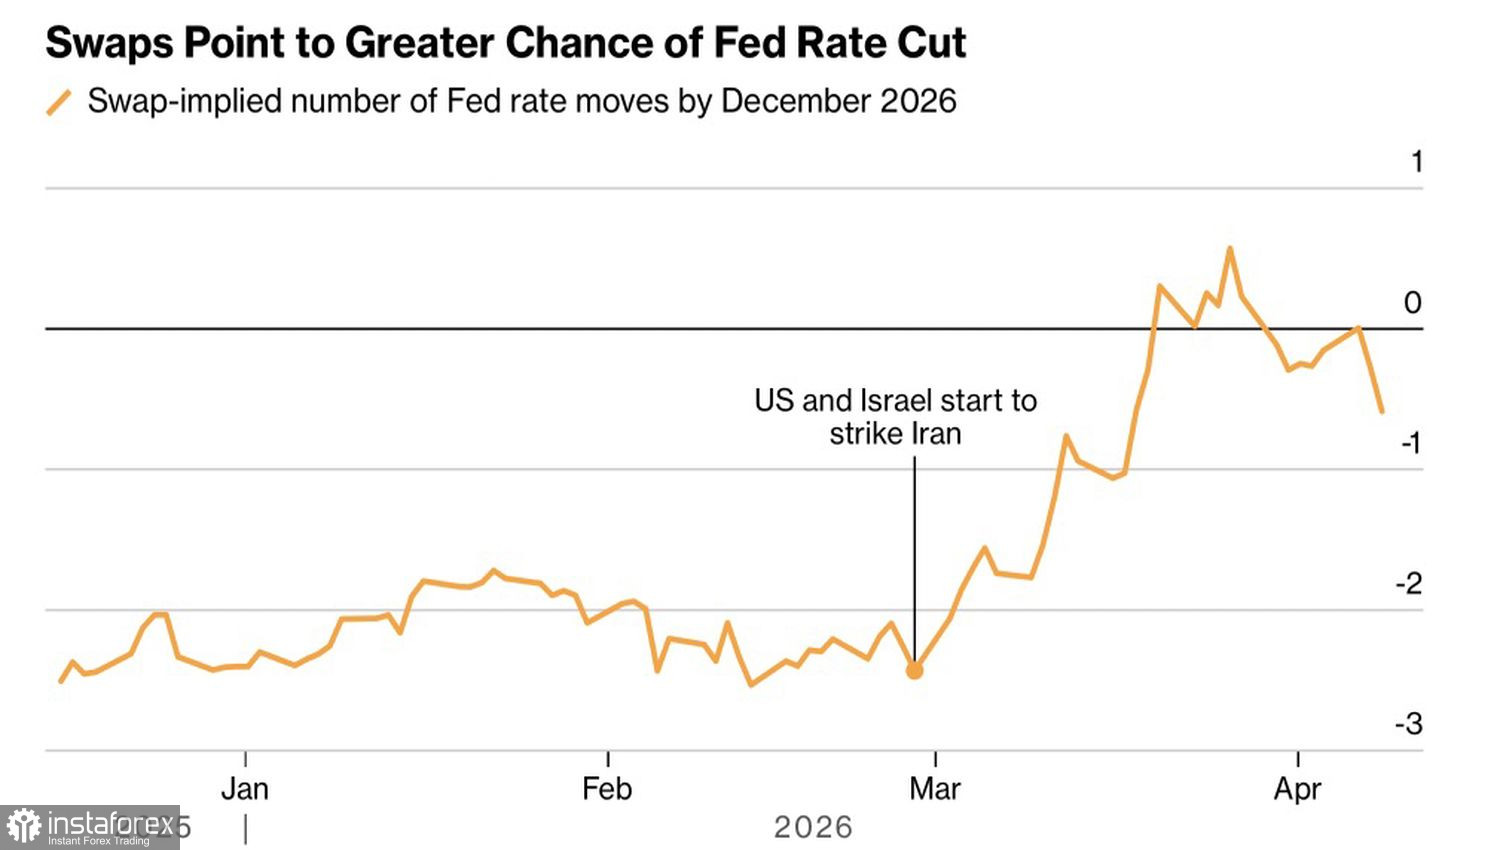
Support for the S&P 500 has come from falling Treasury yields and a revived idea that the Fed may ease monetary policy. Before Trump's announcement of a two-week truce, the futures market priced in a 12% chance of a federal funds rate cut in 2026; afterwards the probability jumped to 44%.
Monetary stimulus and lower Treasury yields would reduce US corporate financing costs, boost earnings, and help restore the uptrend in the broad equity index.
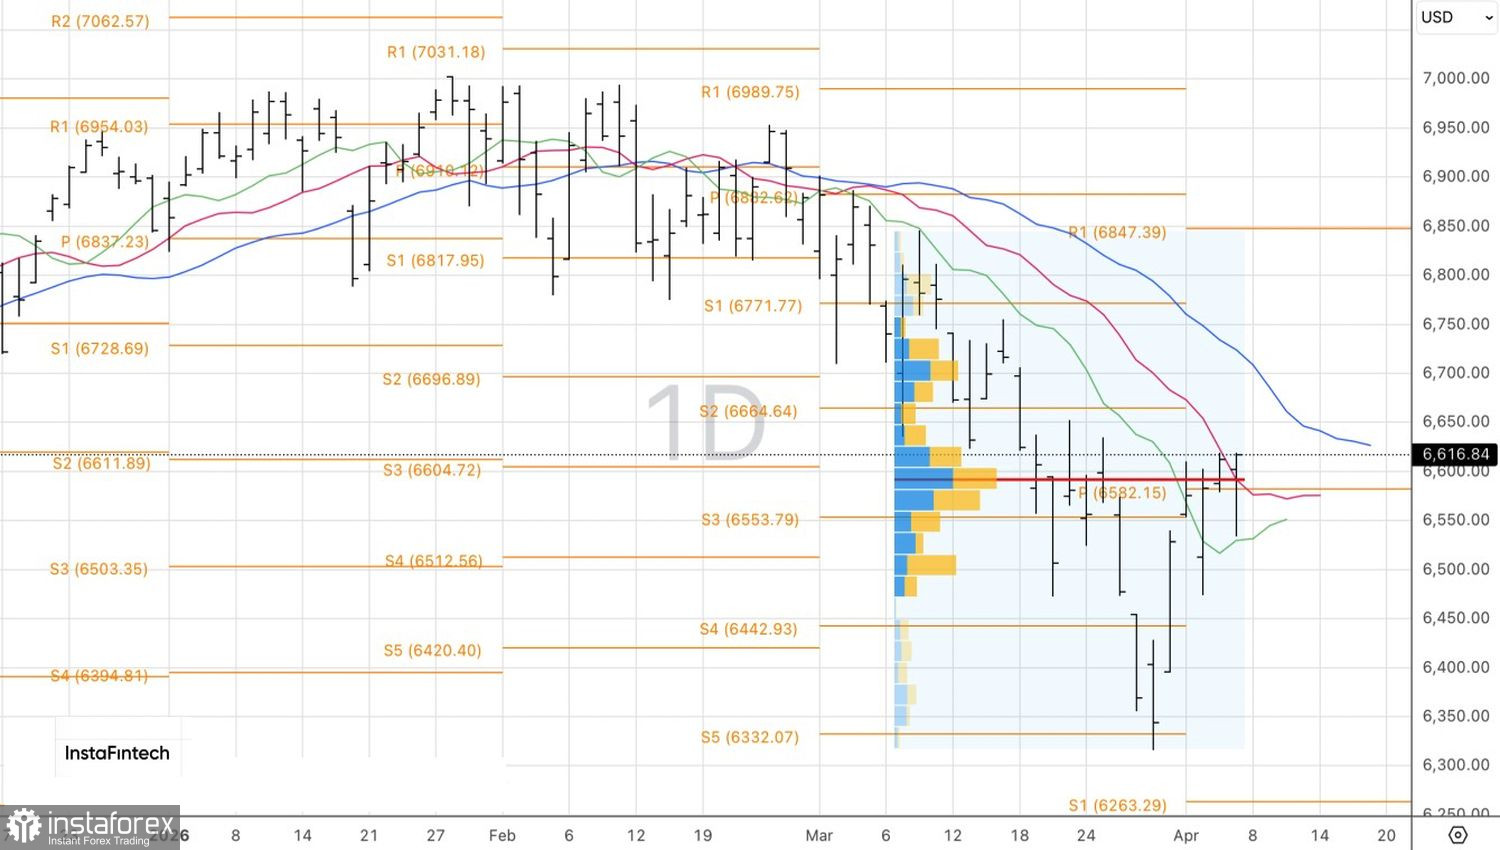
Technically, the daily chart shows that the S&P 500 has formed a pin bar with a long lower shadow, signaling bear weakness. That justifies placing a buy stop slightly above the pin-bar high near 6,620. The probability of a continued rally toward 6,665 and 6,770 is high, so traders should emphasize long positions in the broad index.


