


Analysis of EUR/USD 5M
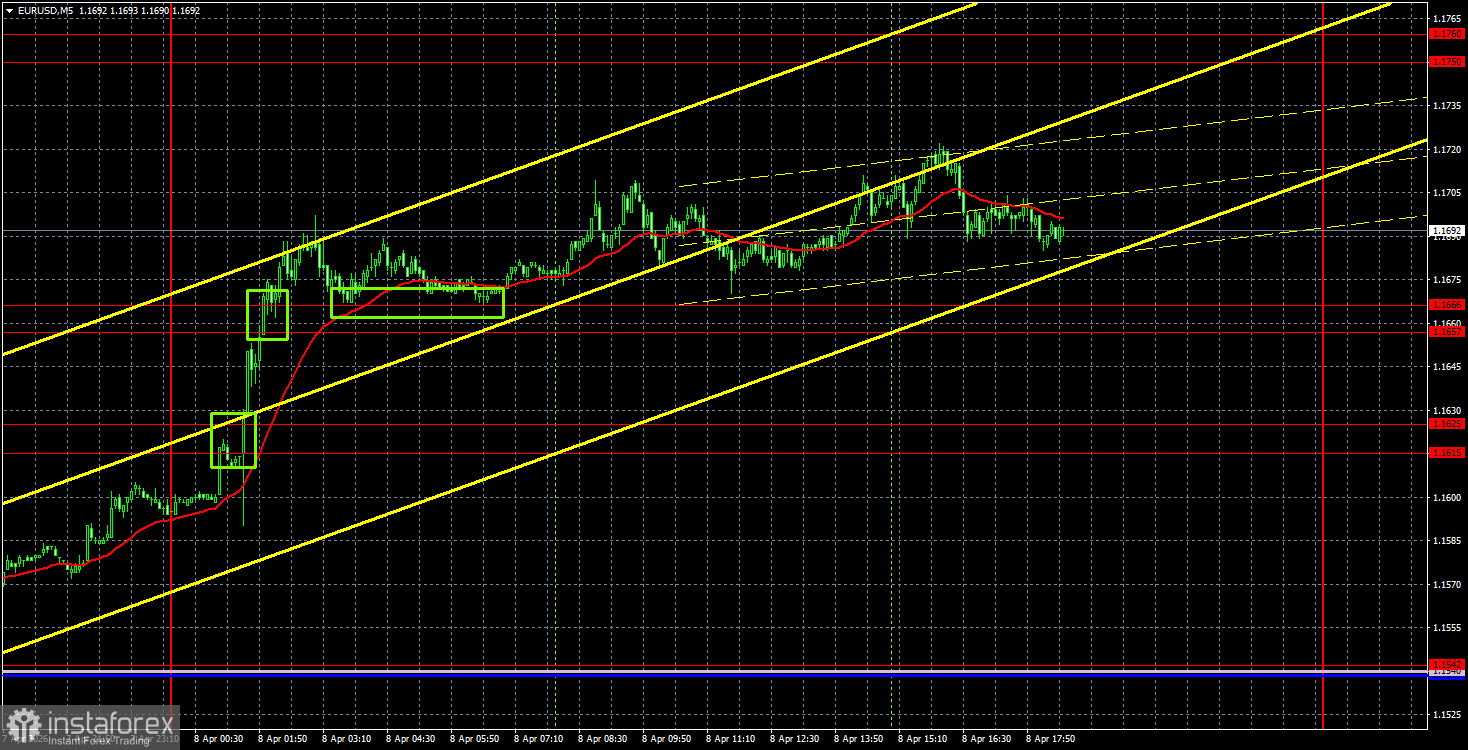
The EUR/USD currency pair surged on Wednesday following news of a ceasefire between Iran and the U.S. However, most of the euro's rise occurred during the overnight trading session, making it challenging for traders to capitalize on it. Throughout the day, the pair continued to move upward, but at a much more modest pace for several reasons.
Firstly, military action resumed in the Middle East on Wednesday afternoon. The U.S. attacked an Iranian oil refinery, Iran responded by targeting Kuwait, and Israel was attacking Lebanon throughout the day. Consequently, the ceasefire currently looks extremely unconvincing. Nonetheless, there have been no reports from either Iran or the U.S. that the ceasefire has ended, despite having lasted less than a day. Therefore, traders continued to buy for the majority of Wednesday.
From a technical standpoint, a new upward trend has formed, with the potential to be long-lasting but could end at any time. If it turns out today that the ceasefire exists only on paper and the parties intend to continue the war in the Middle East, the pair could quickly return to where it started its rise on Wednesday night—around the 1.1550 level. Further down, it could fall even lower. Thus, it is still too early to celebrate the end of the war in the Middle East.
On the 5-minute time frame, two buy signals were generated on Wednesday night, with one occurring just before the opening of the European trading session. Traders likely only had the opportunity to act on the last signal. Following the formation of this signal, the pair moved up by about 30 pips, which still counts as a profit.
COT Report
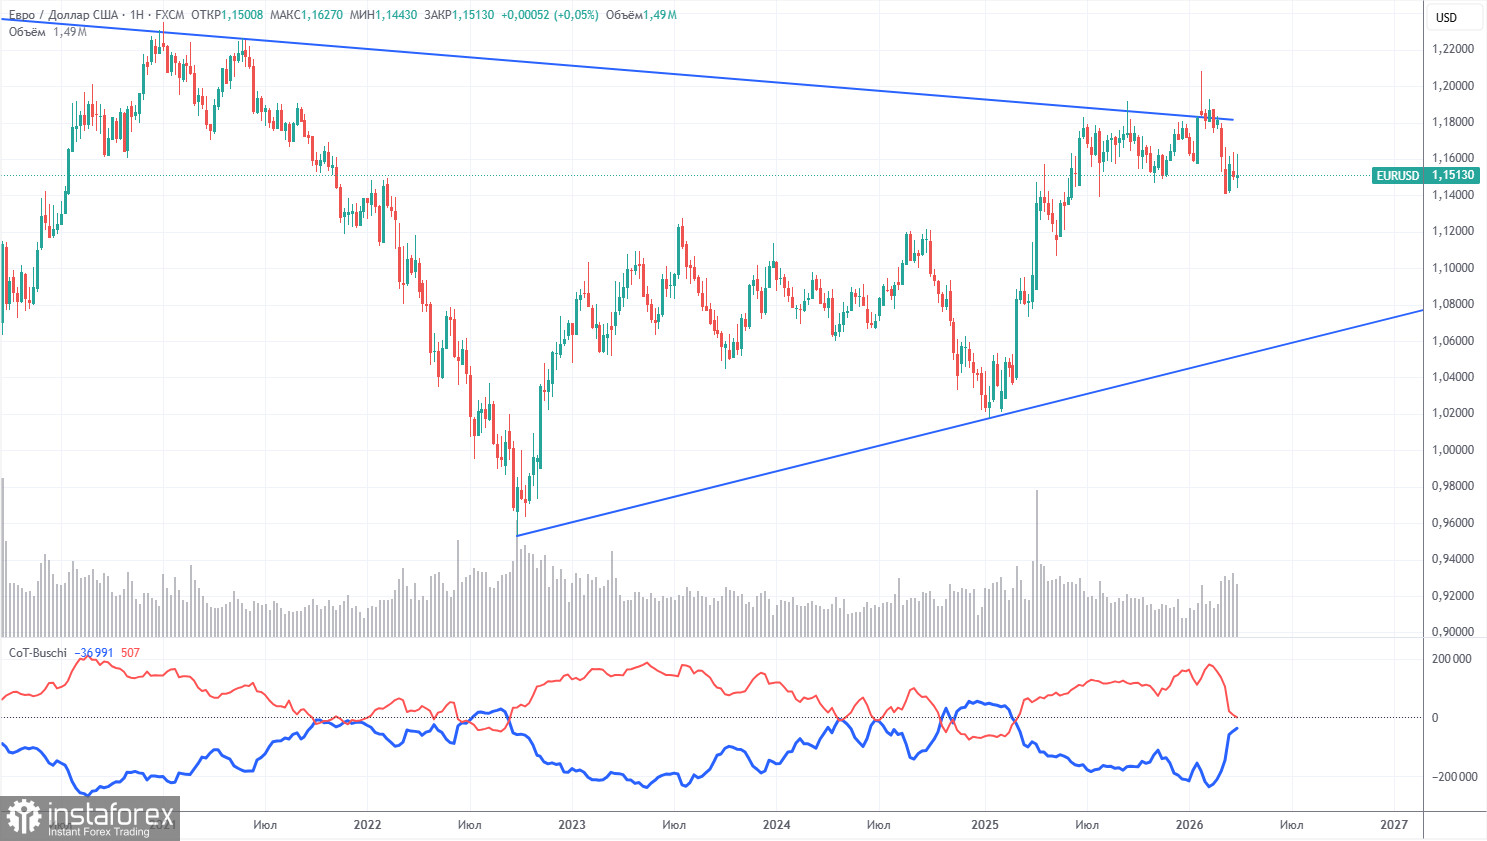
The latest COT report is dated March 31. In the illustration of the weekly time frame, it is evident that the net position of non-commercial traders remains "bullish," but is rapidly declining amid geopolitical events. Traders are mass-selling the euro in favor of the U.S. dollar. Trump's policies have not changed, but the dollar is once again acting as a "reserve currency," which ensures high demand for it.
We still do not see any fundamental factors supporting a strengthening euro. However, many factors remain that could trigger a decline in the American dollar. The war in the Middle East has temporarily made the dollar super attractive, but once this factor expires, everything could revert to the previous state. In the long term, the euro could fall as low as 1.06 (the trend line), but the upward trend will remain relevant.
The positioning of the red and blue lines of the indicator continues to indicate a maintenance of the "bullish" trend. During the last reporting week, the number of long positions in the "Non-commercial" group increased by 100, while short positions increased by 8,900. Consequently, the net position decreased by another 8,800 contracts over the week.
Analysis of EUR/USD 1H
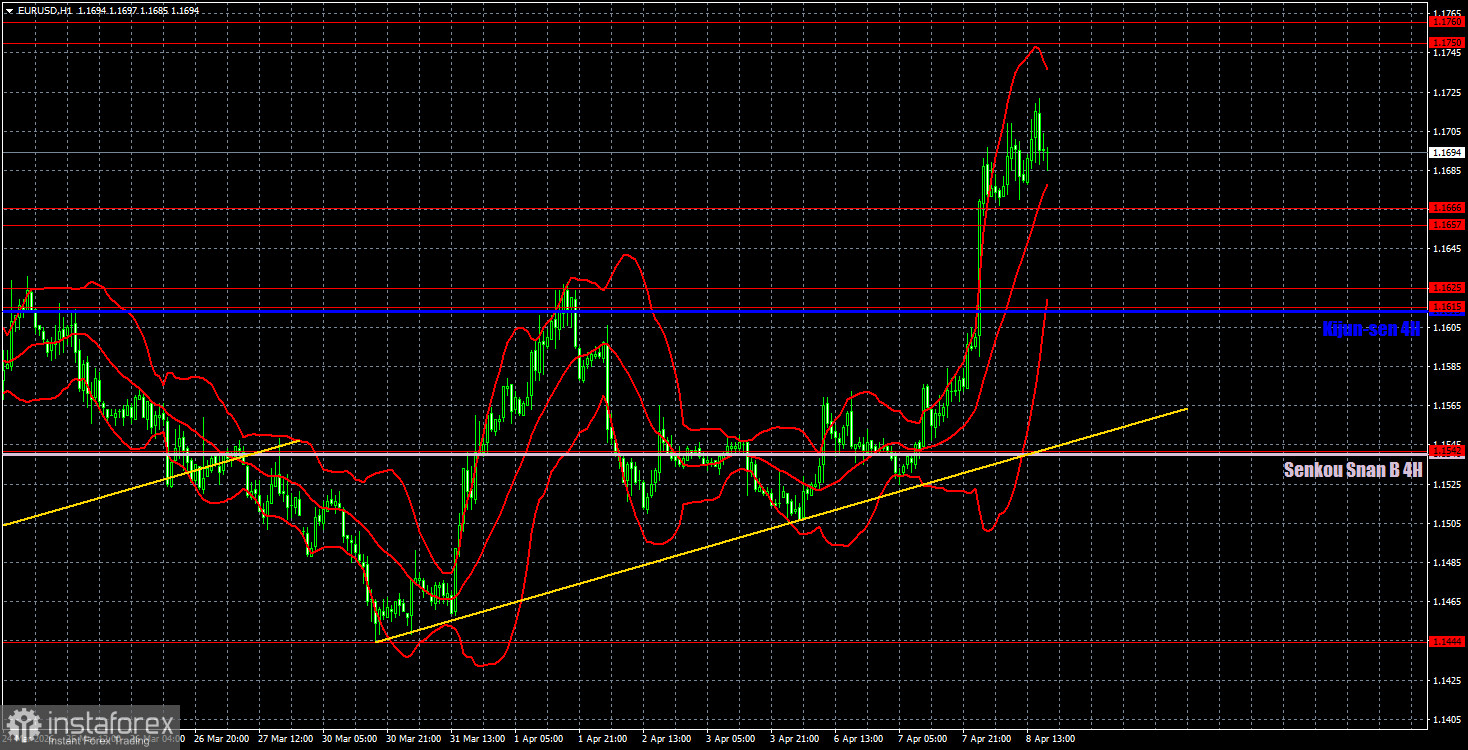
On the hourly time frame, the EUR/USD pair has begun a new upward trend. A new escalation in the Middle East could once again shift traders' trading priorities, so any rise should be approached with caution. In the near future, we need to determine whether a ceasefire is in place and whether further negotiations will take place between the parties. This will impact the dynamics of the EUR/USD pair.
For April 9, we highlight the following levels for trading: 1.1234, 1.1274, 1.1362, 1.1426, 1.1542, 1.1615-1.1625, 1.1657-1.1666, 1.1750-1.1760, 1.1830-1.1837, as well as the Senkou Span B line (1.1542) and the Kijun-sen line (1.1612). The Ichimoku indicator lines may shift during the day, which should be taken into account when determining trading signals. Don't forget to set a stop-loss order to breakeven if the price moves in the correct direction by 15 pips. This will safeguard against potential losses if the signal turns out to be false.
On Thursday, a report on industrial production will be published in the Eurozone, specifically in Germany, while in the U.S., the core personal consumption price index and the third estimate of fourth-quarter GDP will be released. In our opinion, the GDP report could create additional problems for the dollar. However, the fate of the American currency still depends on events in the Middle East to the tune of 90%.
Trading Recommendations:
On Thursday, traders may consider short positions if the price bounces off the 1.1750-1.1760 area, targeting 1.1657-1.1666. Long positions can be held with a target of 1.1750-1.1760, as the price has consolidated above the 1.1657-1.1666 range.
Explanations For Illustrations:
- Support and resistance price levels – thick red lines around which movement may end. They are not sources of trading signals.
- Kijun-sen and Senkou Span B lines – lines of the Ichimoku indicator transferred from the 4-hour timeframe to the hourly timeframe. They are strong lines.
- Extreme levels – thin red lines from which the price previously bounced. They are sources of trading signals.
- Yellow lines – trend lines, trend channels, and any other technical patterns.
- Indicator 1 on COT charts – the size of the net position for each category of traders.


