


Analysis of EUR/USD 5M
The EUR/USD currency pair opened 55 pips lower on Monday than it closed on Friday. It cannot be said that the pair lost significantly due to events over the weekend, as most of the gap was closed throughout the day. Thus, we can immediately conclude that the market remains optimistically inclined, or perhaps it has simply grown tired of geopolitical factors. It is worth noting that the influence of geopolitics has a shelf life that no one knows. The market cannot trade solely on geopolitics for a year or two, or more. Two months, in our view, is a very long time, especially considering the near-total neglect of almost all other macroeconomic and fundamental factors. Therefore, it is quite possible that the market is returning to its habitual trading mode, driven by fundamentals and macroeconomic factors. And here, the dollar has little to hope for.
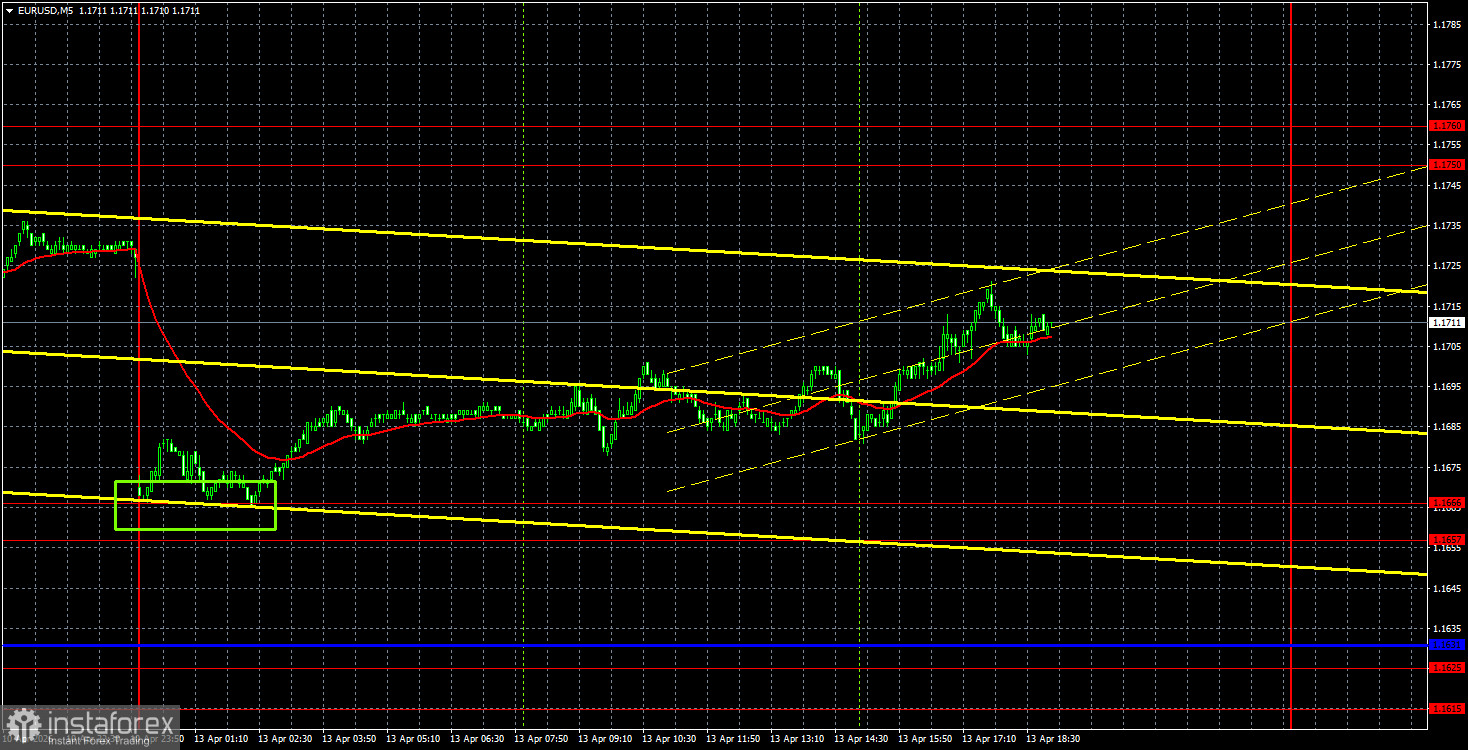
From a technical perspective, the formation of a new upward trend continues, as evidenced by the trend line. On Monday, the pair was unable to overcome even the nearest support area, so there are no grounds to expect a more substantial decline. Of course, geopolitics can still lend support to the dollar, but the market has virtually not reacted to Trump's blockade of the Strait of Hormuz. Because things can't get much worse. The Strait of Hormuz was blocked even without Trump.
On the 5-minute timeframe yesterday, exactly one trading signal was formed. Early in the night, shortly after the gap, the price bounced off the 1.1657-1.1666 area and then moved in only one direction throughout the day: upward. However, it was quite challenging to capitalize on this buy signal since it was generated at night. By the time the European trading session opened, the price had retreated from the point of formation by 10 pips, making it permissible to open long positions.
COT Report
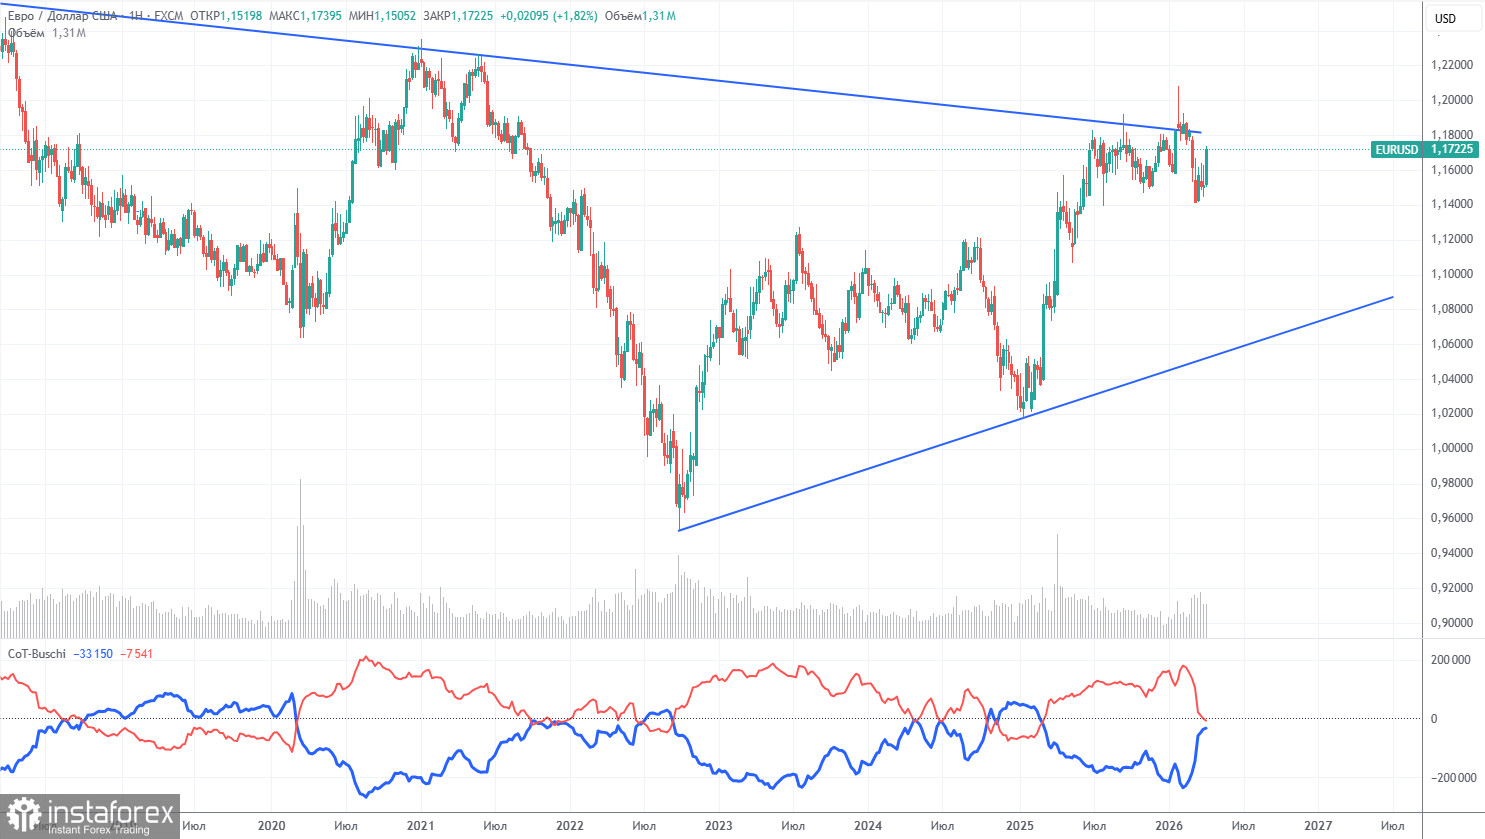
The latest COT report is dated April 7. The illustration of the weekly timeframe clearly shows that the net position of non-commercial traders remains "bullish," but is rapidly declining amid geopolitical events. Traders are mass-selling the euro in favor of the US dollar. Trump's policies have not changed, but the dollar is now acting as a "reserve currency," which ensures its high demand.
We still do not see any fundamental factors supporting the strengthening of the euro, while there remain sufficient factors for the decline of the US dollar. The war in the Middle East temporarily made the dollar super attractive, but once this factor reaches its "expiration date," everything will return to the norm. In the long term, the euro could fall to around 1.06 (the trend line), but the upward trend will nonetheless remain relevant. Currently, the pair has not deviated too far from the descending trend line, which has been broken several times.
The position of the red and blue lines of the indicator indicates parity between bulls and bears. Over the last reporting week, the number of longs among the "Non-commercial" group increased by 800, while the number of shorts increased by 8,800. Accordingly, the net position decreased by another 8,000 contracts over the week.
Analysis of EUR/USD 1H
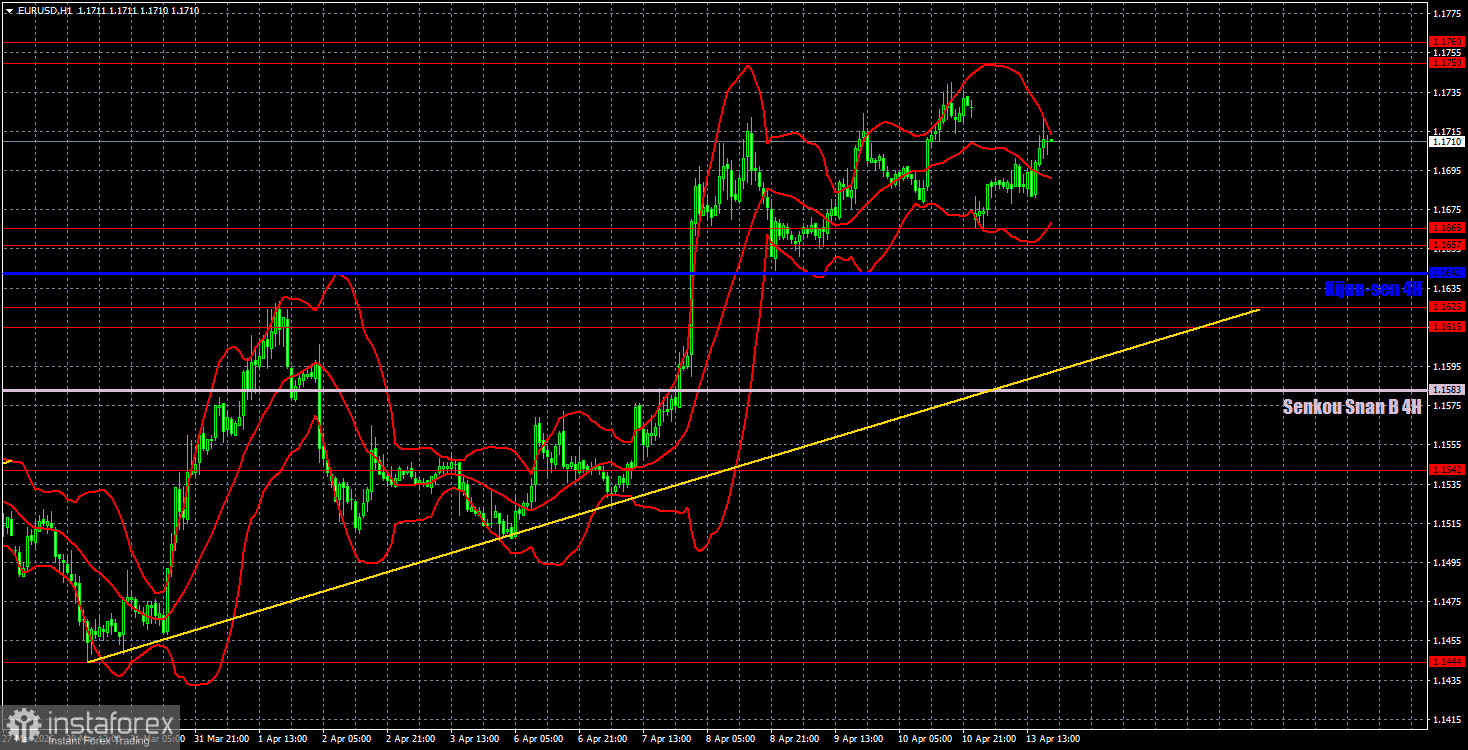
On the hourly timeframe, the EUR/USD pair continues its upward trend. A new escalation in the Middle East could again shift traders' priorities, so caution is advised regarding any growth in the pair. At the same time, the situation in the Middle East remains consistently tense but is not deteriorating, so there are few strong reasons to further strengthen the US dollar. There are no technical grounds to expect a decline at this time.
On April 14, we highlight the following levels for trading: 1.1234, 1.1274, 1.1362, 1.1426, 1.1542, 1.1615-1.1625, 1.1657-1.1666, 1.1750-1.1760, 1.1830-1.1837, as well as the Senkou Span B line (1.1583) and the Kijun-sen line (1.1642). The lines of the Ichimoku indicator may move throughout the day, which should be considered when determining trading signals. Don't forget to set your stop-loss order at breakeven if the price has moved in the right direction by 15 pips. This will protect against potential losses if the signal turns out to be false.
On Tuesday, the US will release the ADP private-sector employment report and the Producer Price Index. We consider both reports to be of little significance. In the Eurozone, Christine Lagarde will give a speech that, under current circumstances, is not regarded as a major event.
Trading Recommendations:
On Tuesday, traders may consider short positions if the price bounces from the 1.1750-1.1760 area, targeting 1.1657-1.1666. Long positions can be maintained with a target of 1.1750-1.1760, as the price has rebounded from the 1.1657-1.1666 area.
Explanations for Illustrations:
Support and resistance price levels are thick red lines around which the movement may end. They are not sources of trading signals.
The Kijun-sen and Senkou Span B lines are lines of the Ichimoku indicator, transferred to the hourly timeframe from the 4-hour timeframe. They are strong lines.
Extreme levels are thin red lines from which the price previously rebounded. They are sources of trading signals.
Yellow lines are trend lines, trend channels, and any other technical patterns.
Indicator 1 on the COT charts shows the size of the net position of each category of traders.


