


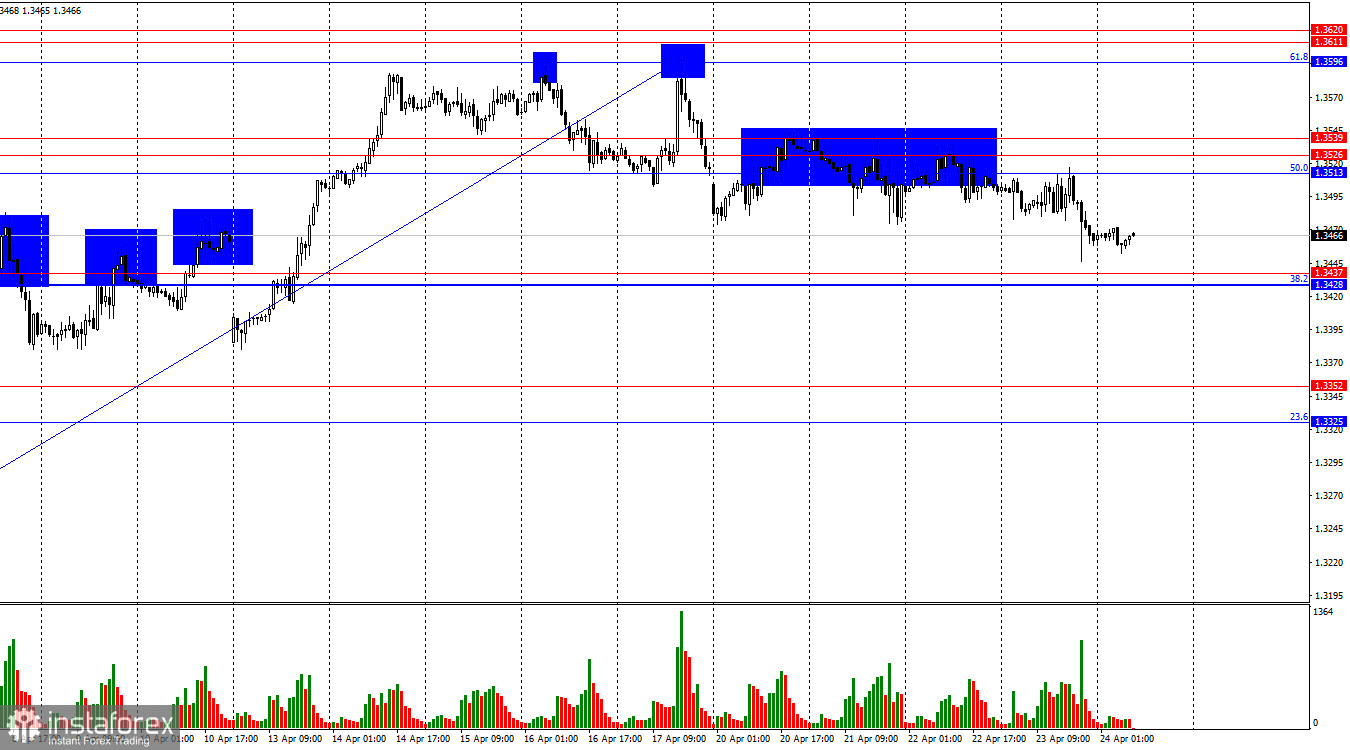
On the hourly chart, the GBP/USD pair on Thursday once again rebounded from the resistance level of 1.3513–1.3539, reversed in favor of the U.S. dollar, and began declining toward the nearest support level of 1.3428–1.3437. A rebound from this zone would allow for a reversal back in favor of the pound and some growth toward 1.3513–1.3539. A consolidation below the 1.3428–1.3437 level would increase the chances of further decline toward the next level of 1.3325–1.3352.
The wave situation remains "bullish." The last completed upward wave broke the previous peak, while the new downward wave did not break the previous low. Geopolitics gave bears an almost complete advantage in the market for two months, after which the geopolitical background supported bulls for two weeks. At present, the situation in the Middle East is contradictory, so traders are in a pause mode. To break the bullish trend, two downward waves or a break below the April 6 low are required.
The news background on Thursday and Friday gave bullish traders four opportunities to go on the offensive. However, they were unable to overcome the resistance level of 1.3513–1.3539 and ignored the entire economic backdrop from the UK. Earlier in the week, important reports on unemployment and inflation were released, which also failed to trigger any reaction from traders. Thus, the PMI and retail sales data initially had very low chances of prompting a market response. Nevertheless, the composite index rose to 52 points in April, the services sector increased to 52, and the manufacturing sector to 53.6. All reports came in stronger than forecasts. This morning it was also reported that retail sales volumes increased by 0.7% month-over-month and 1.7% year-over-year in March, also exceeding market expectations. Yet none of this data helped the British currency in any way. The market continues to ignore all news not related to geopolitics and remains highly selective even within geopolitical developments.
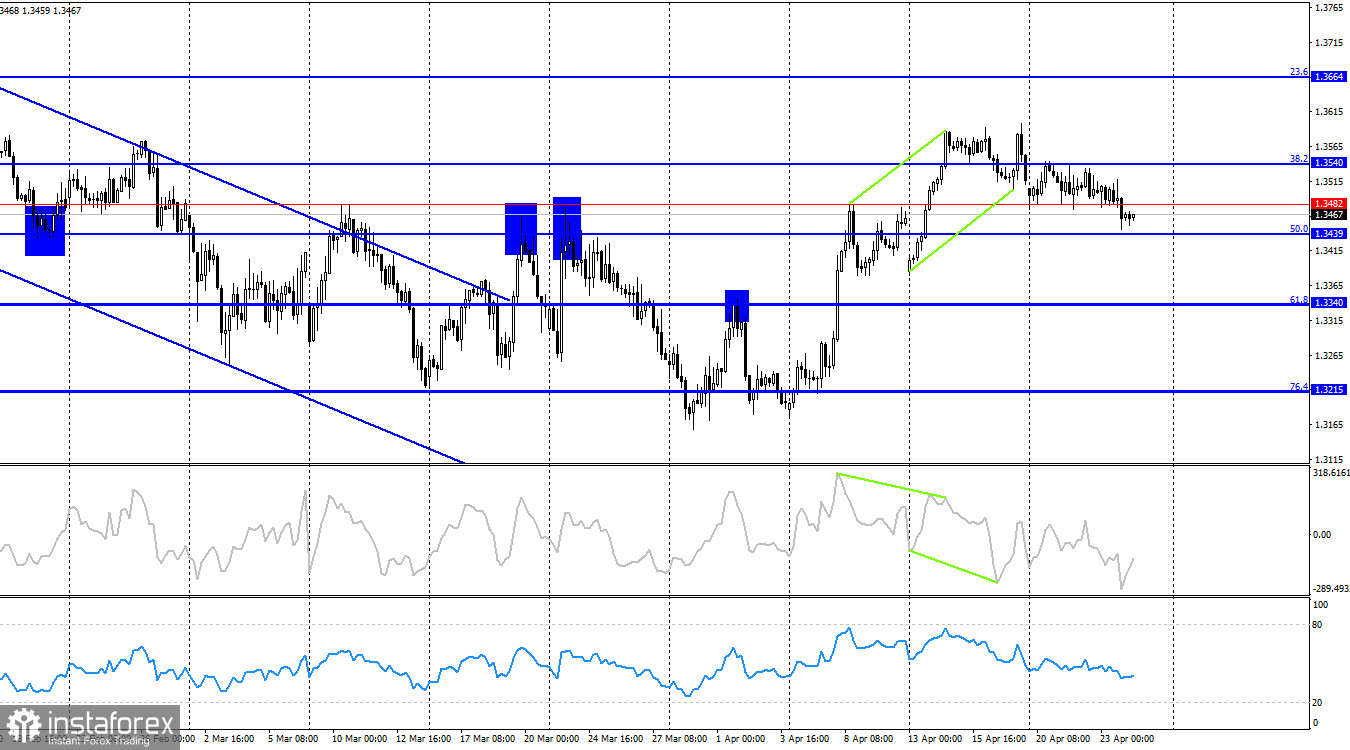
On the 4-hour chart, the pair consolidated above a downward trend channel, which allows for expectations of a full-fledged trend. After forming a bearish divergence on the CCI indicator, the pair reversed in favor of the U.S. dollar and consolidated below the 38.2% Fibonacci retracement level at 1.3540. However, prices then became stuck between 1.3482 and 1.3540 and only yesterday managed to resume the decline. The chart pattern on the hourly timeframe is currently clearer, so it is advisable to base decisions on it. No new emerging divergences are observed today.
Commitments of Traders (COT) Report:
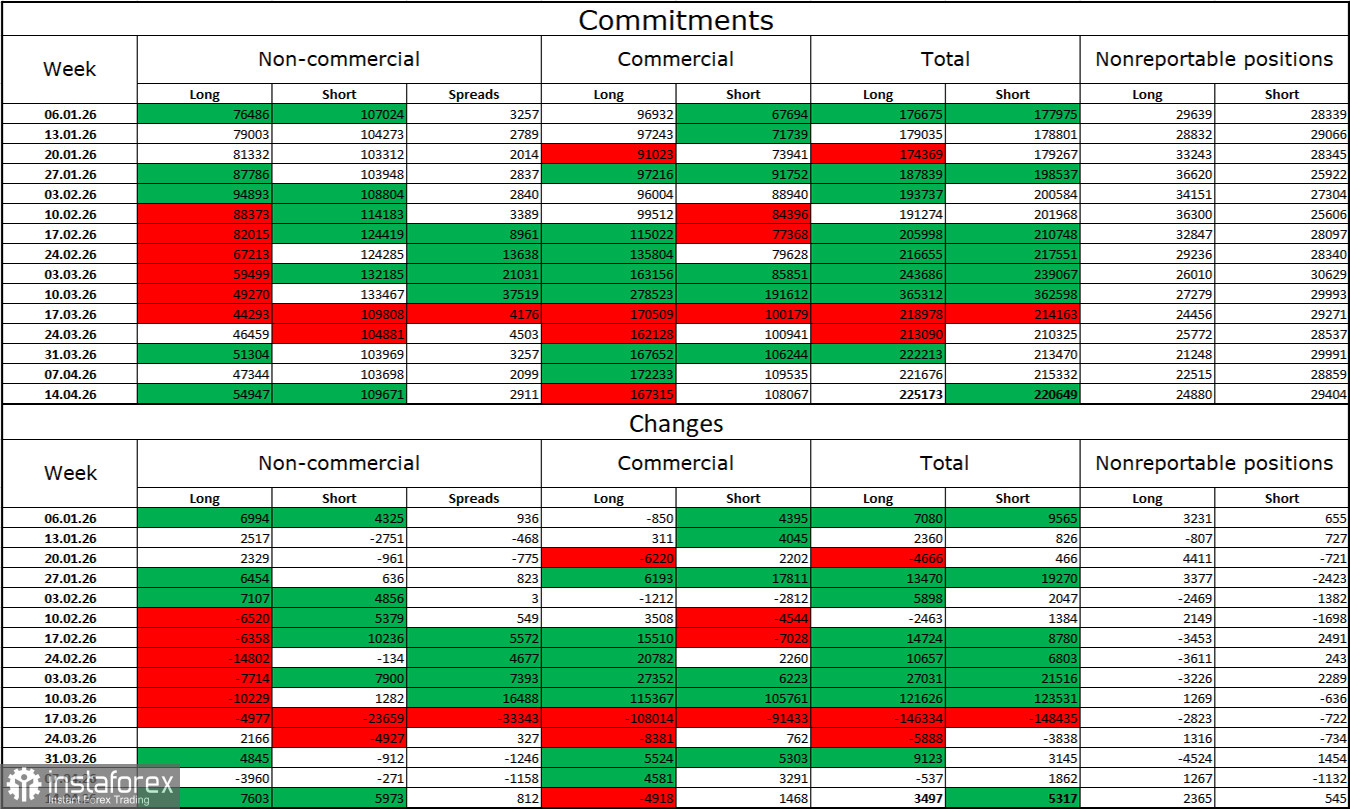
The sentiment of the "Non-commercial" trader category became less bearish over the last reporting week. The number of long positions held by speculators increased by 7,603, while short positions rose by 5,973. The gap between long and short positions now stands roughly at 55,000 versus 110,000. For six consecutive weeks, non-commercial traders actively increased short positions and reduced long ones, leading to a significant imbalance. In recent weeks, bears have dominated, which raises no questions given the geopolitical situation.
I still do not believe in a sustained bearish trend for the pound, but now everything depends not on economic indicators, Trump's trade policy, or central bank monetary policy, but on the duration, scale, and consequences of the war in the Middle East. In recent weeks, the market had shifted toward expectations of de-escalation, but the latest news suggests that a full ceasefire remains far off, and the conflict could resume at any moment. In that case, the bears' advantage could become even stronger.
Economic Calendar for the US and UK:
- UK – Retail Sales (06:00 UTC)
- US – University of Michigan Consumer Sentiment Index (14:00 UTC)
On April 24, the economic calendar contains just two entries, which may again be ignored, as has been the case with most reports this week. The impact of the news background on market sentiment on Friday may once again be very weak.
GBP/USD Forecast and Trading Tips:
Selling opportunities were available following a rebound from the 1.3513–1.3539 level on the hourly chart, targeting 1.3428–1.3437. These short positions can still be held today. New selling positions may be considered after a close below 1.3428–1.3437, targeting 1.3325–1.3352. Buying opportunities may arise after a rebound from 1.3428–1.3437, targeting 1.3513–1.3539.
Fibonacci retracement levels are drawn from 1.3866 to 1.3158 on the hourly chart, and from 1.3012 to 1.3868 on the 4-hour chart.


