


Trade Review and Tips for Trading the Japanese Yen
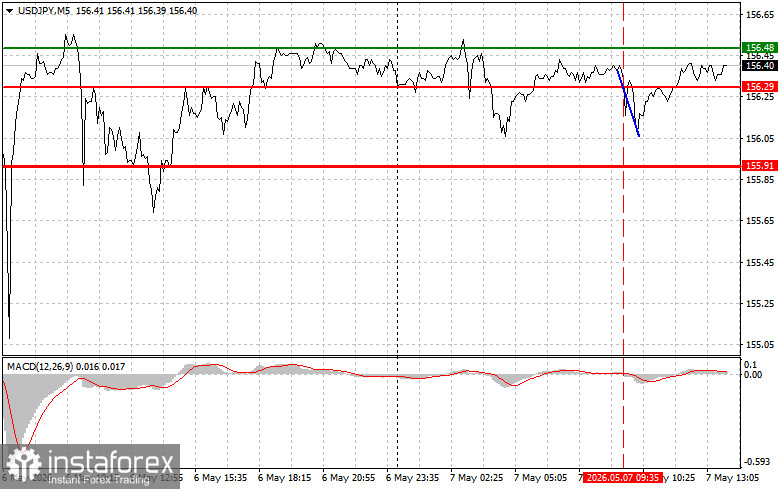
The test of the 156.29 price level occurred at the moment when the MACD indicator had just started moving downward from the zero line, confirming a valid entry point for selling the U.S. dollar. As a result, the pair declined by 25 points.
In the afternoon trading hours, market participants' main attention will be drawn to the release of initial jobless claims data. A significant deviation from analysts' expectations is highly likely to trigger an active reaction in the currency market. At the same time, scheduled speeches by Federal Reserve officials Beth M. Hammack and John Williams will attract considerable interest. Traders will closely analyze policymakers' comments, trying to assess how closely their stance aligns with the Fed's overall hawkish tone.
In addition, new statements from Trump regarding the Middle East are expected during the U.S. session. However, the main trigger will be Iran's response to yesterday's U.S. proposal. If it is rejected, the risk of escalation in the military conflict will increase sharply.
As for the intraday strategy, I will mainly rely on the implementation of Scenarios No. 1 and No. 2.
Buy Signal
Scenario No. 1:
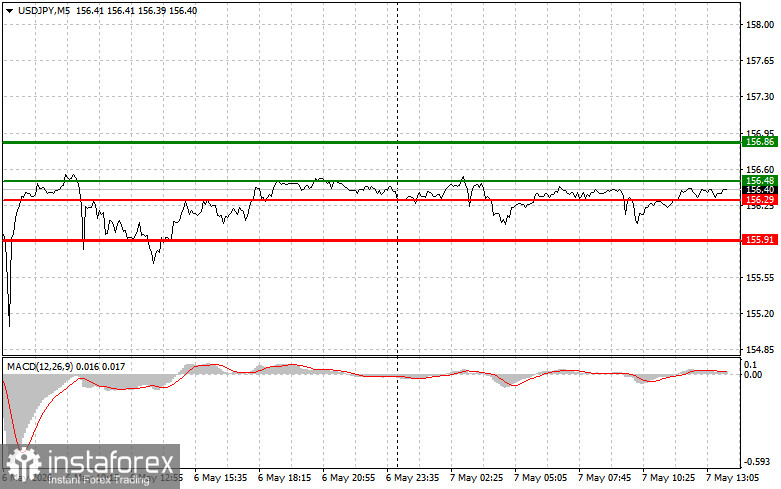
Today, I plan to buy USD/JPY at the 156.48 level (green line on the chart), targeting a rise toward 156.86 (thicker green line on the chart). At 156.86, I will exit long positions and open short positions in the opposite direction, targeting a 30–35 point move downward. Further upside in the pair today is only possible with strong U.S. data.
Important: Before buying, make sure the MACD indicator is above the zero line and just beginning to rise from it.
Scenario No. 2:
I also plan to buy USD/JPY if there are two consecutive tests of the 156.29 level while the MACD indicator is in oversold territory. This would limit downward potential and trigger a reversal upward. In this case, a move toward 156.48 and 156.86 can be expected.
Sell Signal
Scenario No. 1:
I plan to sell USD/JPY after a break below the 156.29 level (red line on the chart), which would lead to a rapid decline in the pair. The key target for sellers is 155.91, where I will exit short positions and immediately open buy positions in the opposite direction, targeting a 20–25 point rebound.
Downward pressure on the pair may return today if weak U.S. data is released.
Important: Before selling, make sure the MACD indicator is below the zero line and just beginning to decline from it.
Scenario No. 2:
I also plan to sell USD/JPY if there are two consecutive tests of the 156.48 level while the MACD indicator is in overbought territory. This would limit upward potential and trigger a downward reversal. A decline toward 156.29 and 155.91 can then be expected.
What is on the chart:
- Thin green line – entry price for buying the trading instrument;
- Thick green line – estimated take-profit level or area for manual profit-taking, as further growth above this level is unlikely;
- Thin red line – entry price for selling the trading instrument;
- Thick red line – estimated take-profit level or area for manual profit-taking, as further decline below this level is unlikely;
- MACD indicator – when entering the market, it is important to rely on overbought and oversold zones.
Important
Beginner Forex traders should make market entry decisions very carefully. Before important fundamental data releases, it is best to stay out of the market to avoid sharp price fluctuations. If you choose to trade during news events, always set stop-loss orders to minimize losses. Without stop-losses, you can quickly lose your entire deposit, especially if you do not use proper money management and trade large volumes.
And remember: successful trading requires a clear trading plan, such as the one presented above. Spontaneous trading decisions based on current market conditions are a fundamentally losing strategy for intraday traders.


