


GBP/USD 5M Analysis
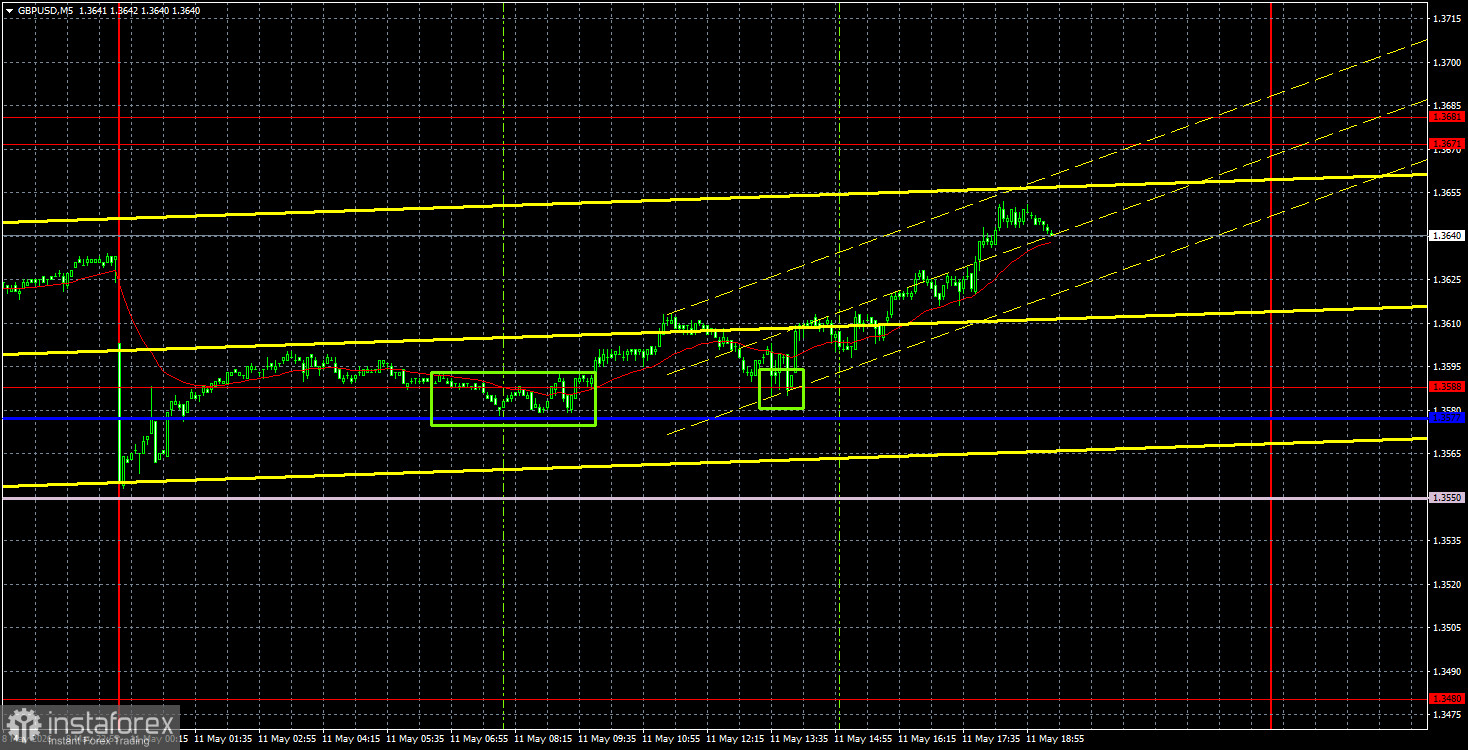
The GBP/USD currency pair also demonstrated movement in both directions on Monday. Initially, the pair dropped by 80 pips but encountered the Senkou Span B line and managed to fully recover before the evening. There were no significant reasons for the pair's decline and the dollar's rise during the day. Negotiations between the US and Iran will continue, and both sides of the conflict will repeatedly reject proposals for peace or violate the terms of the temporary ceasefire. The British pound could very well continue its upward movement. The dollar will only receive support from local geopolitical news.
On the hourly timeframe, the upward trend remains intact, as the price is above the Ichimoku indicator lines. Therefore, there are no grounds to expect a strengthening of the US dollar at this time, neither on geopolitical nor on technical grounds. The market continues to ignore fundamentals and macroeconomics. Thus, there is currently no assistance for the dollar.
On the 5-minute timeframe, two trading signals were formed on Monday. The price bounced twice from the 1.3577-1.3588 area, allowing traders to open long positions. Given that volatility in the pound was significantly higher than that of the euro, these trades could have been closed for a profit of about 40 pips by the end of the day.
GBP/USD 4H Analysis
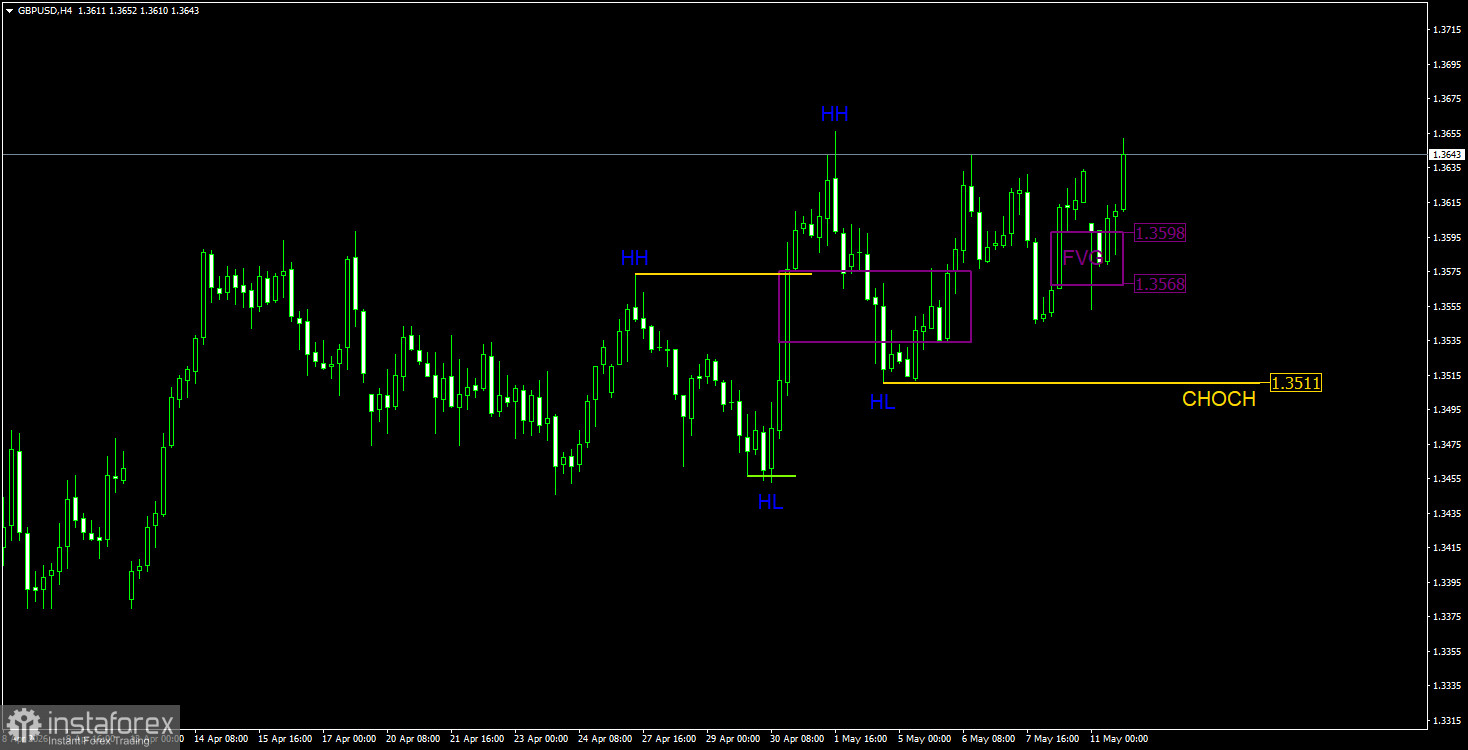
On the 4-hour timeframe, we analyze according to the ICT trading system. The exchange rate of the British pound strongly correlates with the euro, just as the rate of Ethereum corresponds with Bitcoin. Therefore, patterns and signals in EUR/USD should always be closely monitored. The trend on the 4-hour timeframe is also upward, with the CHOCH line at 1.3511; only below this level can we consider the upward trend to be broken. Until that time, we will only look for buy signals. The most recent relevant pattern is the bullish FVG in the 1.3567-1.3598 area, which was addressed on Monday. The price even dipped below this level, but the FVG pattern, consisting of three candles, is considered invalid only when the price moves above the minimum (or below the maximum) point. Thus, our FVG pattern has not been invalidated. At the same time, a similar buy signal was generated in the euro on Monday within a similar pattern. Therefore, long positions could have been opened. The upward movement may continue on Tuesday and Wednesday. No new patterns were formed on Monday, but the price may still clear liquidity from the recent highs.
GBP/USD 1H Analysis
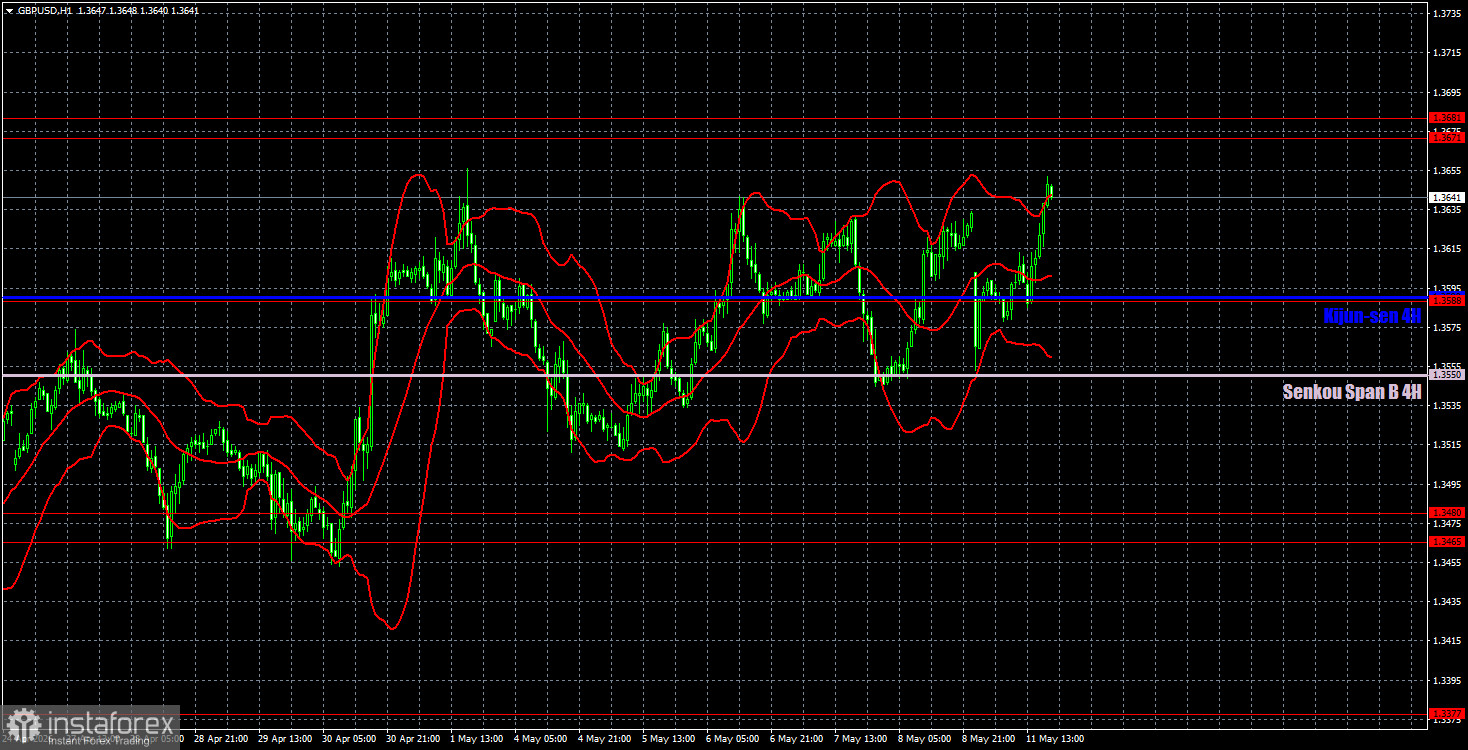
On the hourly timeframe, the GBP/USD pair continues its upward trend, which could be invalidated if the British pound consolidates below the Ichimoku indicator lines. The influence of geopolitics is continuing to weaken; the market no longer pays attention to all news related to the Middle East, and the dollar has lost its only significant support. Even strong Nonfarms on Friday did not help it.
For May 12, we highlight the following important levels: 1.3096-1.3115, 1.3179-1.3187, 1.3369-1.3377, 1.3465-1.3480, 1.3588, 1.3671-1.3681, and 1.3751-1.3763. The Senkou Span B line (1.3550) and Kijun-sen line (1.3590) may also be sources of signals. It is recommended to set a Stop Loss at break-even once the price moves in the correct direction by 20 pips. The Ichimoku indicator lines may move during the day, which should be taken into account when determining trading signals.
On Tuesday, no significant events are scheduled for the UK, while the US will publish an inflation report that could also be ignored by the market, similar to the labor market and unemployment reports on Friday.
Trading Recommendations:
Today, traders may consider short positions if the price bounces back from the 1.3671-1.3681 area, targeting the 1.3588 area. Long positions can be opened if there is a bounce from the 1.3588-1.3590 area, targeting the 1.3671-1.3681 area. On the 4-hour timeframe, long positions can be held according to the already formed signal, but keep an eye on potential liquidity takedowns from the recent price extremes.
Explanations for the Illustrations:
- Support and Resistance Levels – Thick red lines at which market movement may end. These are not sources of trading signals.
- Kijun-sen and Senkou Span B Lines – Lines from the Ichimoku indicator transferred from the 4-hour timeframe to the hourly timeframe. These are considered strong lines.
- Extreme Levels – Thin red lines from which the price has previously bounced. These are sources of trading signals.
- Yellow Lines – Trend lines, trending channels, and any other technical patterns.
- CHOCH – Change of the trend structure.
- Liquidity – Liquidity, Stop Loss, and pending orders that market makers use to build their positions.
- FVG – Fair Value Gap. The price rapidly passes through such areas, indicating a complete absence of one party in the market. Subsequently, the price tends to return and react to these areas in alignment with the main trend.
- IFVG – Inverted Fair Value Gap. After returning to such an area, the price does not react from it; instead, it impulsively breaks through and then tests it from the other side.
- OB – Order Block. The candle on which the market maker opened a position aimed at capturing liquidity to form their position in the opposite direction.


