


Analysis of Monday's Trades:
1-Hour Chart of the GBP/USD Pair:
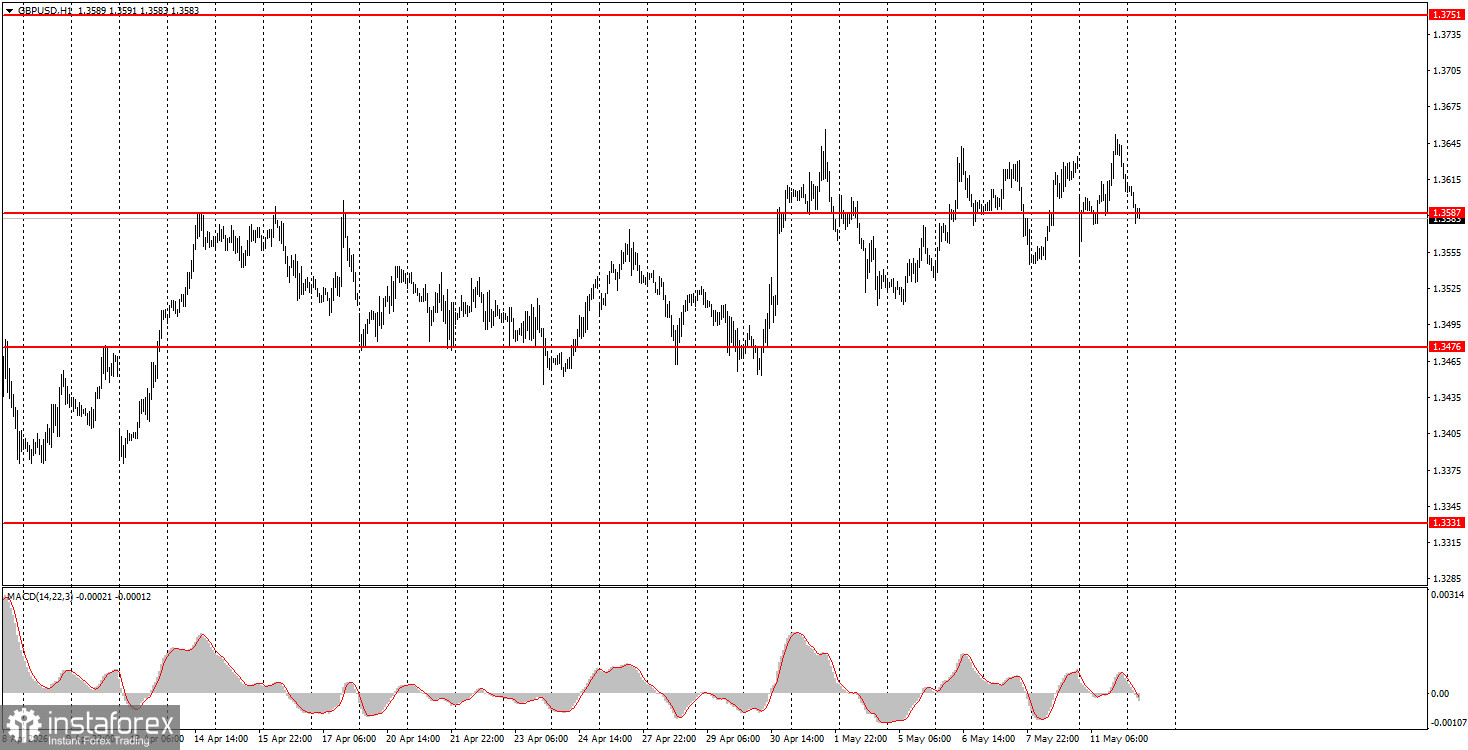
The GBP/USD pair also managed to go down, up, and down again on Monday. As you can see, over the last few days, the price has been flat again; the market reacts only to geopolitical news, which is constantly changing and often signals opposing events and trends. Tehran and Washington once again failed to make any progress in negotiations, but at least agreed to continue talks rather than resume hostilities. There are still no compelling reasons for the US dollar to rise. The macroeconomic backdrop continues to be ignored by the market. On the hourly timeframe, the upward trend remains, but it is relatively weak, as the market awaits any changes regarding the Middle East. Therefore, we have been seeing "swings" for several consecutive weeks. It is unlikely that the situation will change on Tuesday. The only significant event today is the US inflation report, which may be easily disregarded by the market, just as the important labor and unemployment data from Friday were.
5-Minute Chart of the GBP/USD Pair:
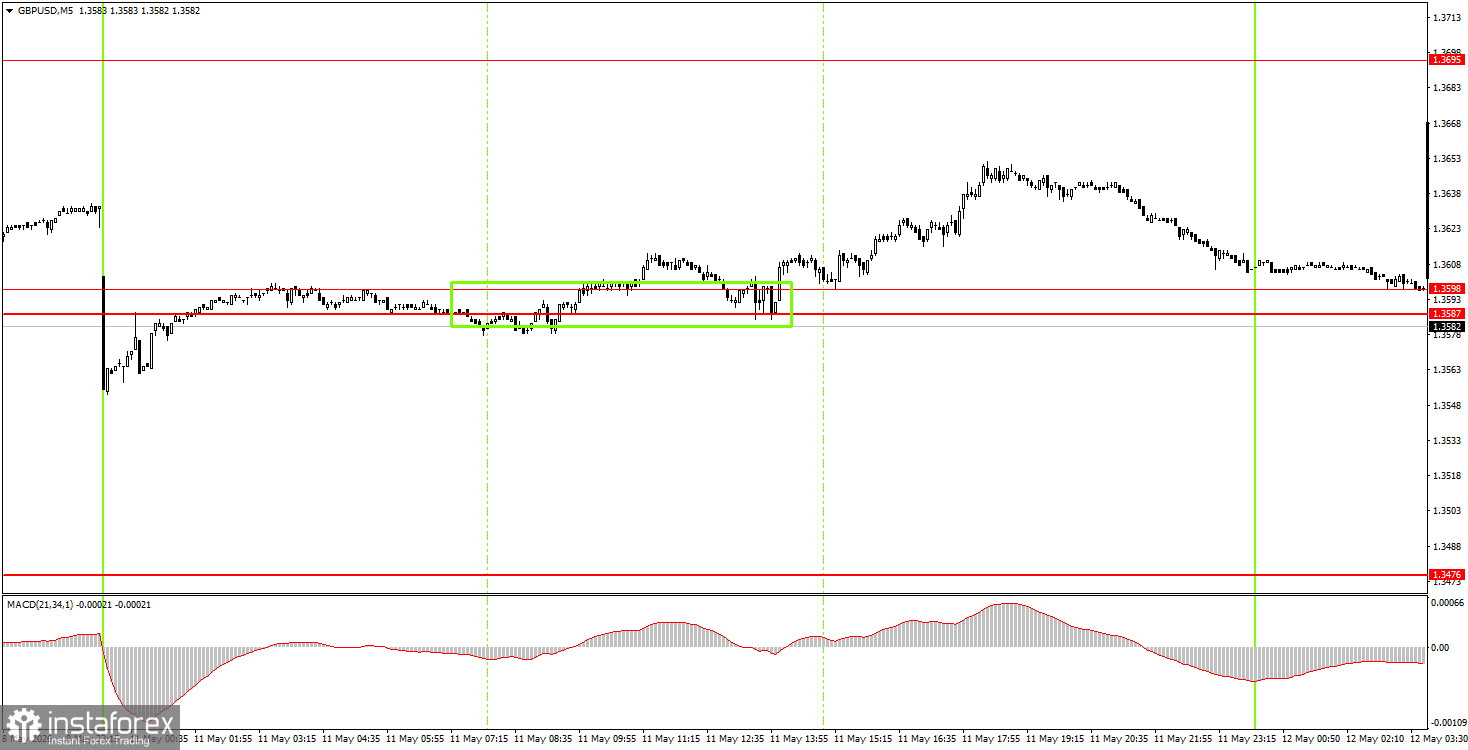
On the 5-minute timeframe, one trading signal for a buy was formed on Monday, allowing beginner traders to earn a little. During the European trading session, the pair bounced from the 1.3587-1.3598 area, but volatility throughout the day was again weak, so we did not see a strong rise. A long position could have generated around 35-40 pips in profit when the trade was manually closed in the evening.
How to Trade on Tuesday:
On the hourly timeframe, the GBP/USD pair maintains its upward trend but has been trading sideways for almost a month. Without a serious escalation in the Middle East, the dollar cannot be expected to rise as it did in February-March. Individual events may still provoke a strengthening of the dollar, but overall, the geopolitical factor has weakened its influence on the market. The British currency retains excellent upward prospects according to daily and weekly timeframe trends.
On Tuesday, beginner traders may consider opening short positions targeting the 1.3456-1.3476 area if the pair consolidates below the 1.3587-1.3598 area. A bounce from the 1.3587-1.3598 area will allow for long positions with a target of 1.3695. Volatility may be weak again today.
On the 5-minute timeframe, the following levels can be traded: 1.3175-1.3180, 1.3259-1.3267, 1.3319-1.3331, 1.3380-1.3386, 1.3456-1.3476, 1.3587-1.3598, 1.3695, and 1.3741-1.3751. Today, the UK calendar of events is completely empty, while in the US, an important inflation report will be released, which, unfortunately, may be ignored by the market.
Main Rules of the Trading System:
- The strength of the signal is determined by the time it took to form the signal (bounce or breakout of the level). The less time it took, the stronger the signal.
- If two or more trades were opened near any level based on false signals, all subsequent signals from this level should be ignored.
- In a flat market, any pair can generate many false signals or none at all. Technical levels may be ignored.
- On the hourly timeframe, it is preferable to trade signals from the MACD indicator only in the presence of good volatility and a trend that is confirmed by a trend line or trend channel.
- If two levels are too close together (5-20 pips apart), treat them as a support or resistance zone.
- After a move of 15 pips in the right direction, a Stop Loss should be set to breakeven.
What is on the Charts:
Price levels (areas) of support and resistance – levels that are targets when opening purchases or sales, or sources of signals.
Red lines – channels or trend lines that display the current trend and indicate which direction is preferable to trade now.
MACD indicator (14, 22, 3) – histogram and signal line – a supporting indicator that can also be used as a source of signals.
Important speeches and reports (contained in the news calendar) can significantly influence the movement of the currency pair. Therefore, during their release, trading should be done as cautiously as possible, or one should exit the market to avoid a sharp price reversal against the preceding movement.
Beginners trading in the Forex market should remember that not every trade can be profitable. Developing a clear strategy and sound money management are key to long-term trading success.


