


Bitcoin continues to decline, ignoring news that the US and Iran may sign a peace agreement in the near future. It seems that traders have grown weary of such news, which often turns out to be nothing more than a falsehood.

Last week ended for spot Bitcoin ETFs with another net outflow — this marks the tenth consecutive day without a single positive result. The number itself is telling: such a streak indicates that institutional investors are consistently reducing their positions in the main crypto asset, regardless of short-term price movements. Against this backdrop, data from CryptoQuant indicate a concerning forecast. Based on the PnL Index Signal, the Bitcoin bear market could last until early 2027. According to the indicator, a large wave of profit-taking began back in October 2025, and historically, such cycles take around 18 months. If history repeats itself, the bottom may not be just around the corner but significantly further away than most market participants anticipate.
The key concept in this forecast is "true capitulation." This marks the end of a bear cycle: the moment when the last holders capitulate and sell their assets at a loss, completely cleansing the market of weak hands. According to CryptoQuant's assessment, such capitulation has not yet been observed. A significant portion of short- and medium-term holders has not yet experienced significant downturns in their profit and loss metrics — they are either slightly in profit or at breakeven, and, psychologically, they are not yet ready to realize losses. As long as this group does not capitulate, the market will remain under constant pressure from potential sellers who seize the opportunity to exit at every bounce — precisely what we have seen in ETF flows over the past few weeks.
As for the intraday strategy in the cryptocurrency market, the strategies and conditions are outlined below.
Bitcoin
Buying Scenarios
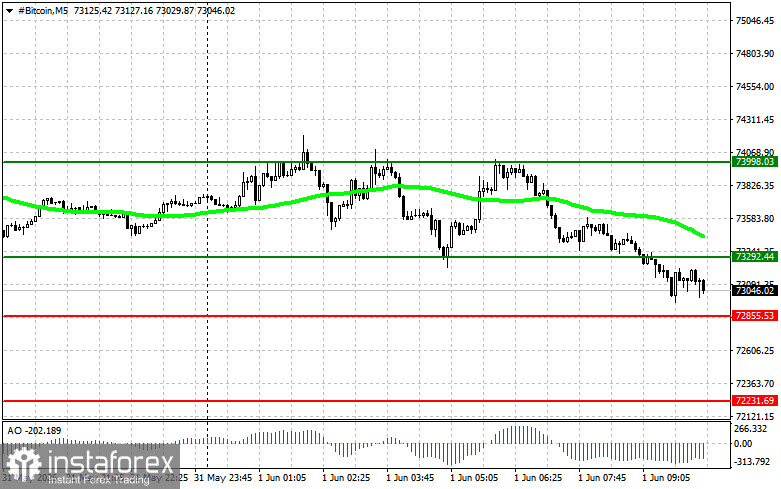
Scenario #1: I plan to buy Bitcoin today upon reaching the entry point around $73,300, targeting a move to $74,000. Around $74,000, I will exit my buy trades and sell immediately on the bounce. Before buying on the breakout, ensure that the 50-day moving average is below the current price and that the Awesome indicator is in the zone above zero.
Scenario #2: I can buy Bitcoin from the lower boundary at $72,800 if there is no market reaction to its breakout back to the levels of $73,300 and $74,000.
Selling Scenarios
Scenario #1: I plan to sell Bitcoin today upon reaching the entry point around $72,800, targeting a decline to $72,200. Around $72,200, I will exit my sell trades and buy immediately on the bounce. Before selling on a breakout, ensure the 50-day moving average is above the current price and the Awesome indicator is in the zone below zero.
Scenario #2: I can sell Bitcoin from the upper boundary at $73,300 if there is no market reaction to its breakout back to the levels of $72,800 and $72,200.
Ethereum
Buying Scenarios
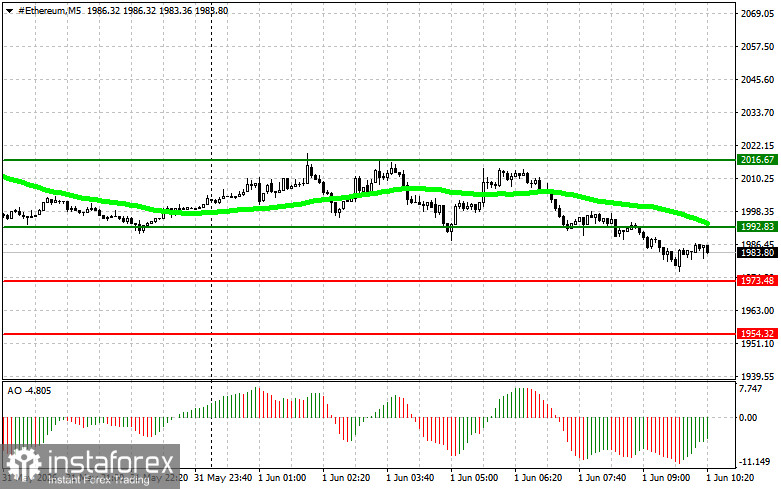
Scenario #1: I plan to buy Ethereum today upon reaching the entry point around $1992, targeting a move to $2016. Around $2016, I will exit my buy trades and sell immediately on the bounce. Before buying on the breakout, ensure that the 50-day moving average is below the current price and that the Awesome indicator is in the zone above zero.
Scenario #2: I can buy Ethereum from the lower boundary at $1973 if there is no market reaction to its breakout back to the levels of $1992 and $2016.
Selling Scenarios
Scenario #1: I plan to sell Ethereum today upon reaching the entry point around $1973, targeting a decline to $1954. Around $1954, I will exit my sell trades and buy immediately on the bounce. Before selling on a breakout, ensure the 50-day moving average is above the current price and the Awesome indicator is in the zone below zero.
Scenario #2: I can sell Ethereum from the upper boundary at $1992 if there is no market reaction to its breakout back to the levels of $1973 and $1954.


