


The GBP/USD currency pair showed a nearly explosive rise in the first half of Thursday's session and has now been rising for six consecutive days. What is behind this sharp change in market sentiment? In our view, the answer is straightforward. First, the latest phase of GBP/USD decline and U.S. dollar strength was neither logical nor justified. Therefore, any current strengthening of the British pound is, by default, logical. Second, traders have begun to doubt that the Federal Reserve will tighten monetary policy more than once as a "preventive" move in 2026. Many major banks believe that already next year the regulator will resume a cycle of monetary easing, while inflation will decline under the influence of falling oil prices. If this is indeed the case, the market has already priced in an event that may never materialize, and the dollar appreciated without justification.
In recent weeks, we have repeatedly stated that any decline in the pair currently looks like a bear trap. Consider the situation: in 2026, the only reason for dollar strength was the conflict in the Middle East. While it cannot be considered fully resolved, it can still be said that it is in a state of remission. And deliberately betting on the worst-case scenario while buying the dollar, we believe this is not a common strategy among market participants. The dollar continues to lose popularity globally. Central banks are reducing dollar reserves, and investors only need the U.S. currency to invest in American technology companies. In all other cases, they prefer to avoid it due to the unstable and uncertain policy of President Trump.
On the daily timeframe, several important observations can also be made. First, GBP/USD has been trading mostly sideways rather than trending up or down for nearly a year, and it is currently near the lower boundary of this range. Therefore, if the market is in a long-term consolidation phase, the British pound may now be starting a new move toward the upper boundary of the range. On the weekly timeframe, it is clearly visible that an upward trend has been in place since 2022, so we still expect further growth in the pair. Second, price has taken liquidity from the March 31 low, which is also a warning signal for a potential move in the opposite direction.
Regarding the fundamental backdrop, Bank of England Governor Andrew Bailey clearly stated at the Sintra economic forum that the regulator will not rush to raise interest rates and may resume rate cuts next year. Inflation in the UK stands at 2.8%; the Bank of England allows it to rise to 3.2%–3.3%, but expects it to slow afterward. With inflation at these levels, there is no reason for the Bank of England to raise rates and put pressure on the UK economy. However, by the same logic discussed in the EUR/USD article, a more dovish stance from the Bank of England may not prevent the pound from continuing to rise.
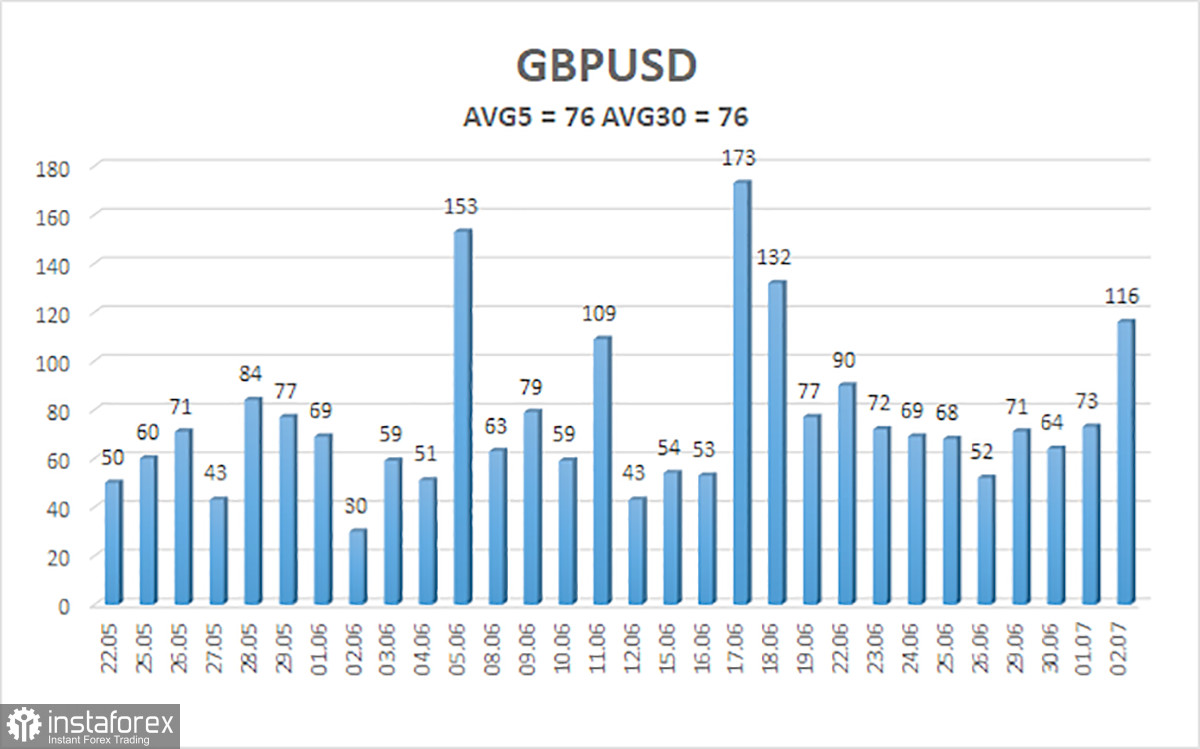
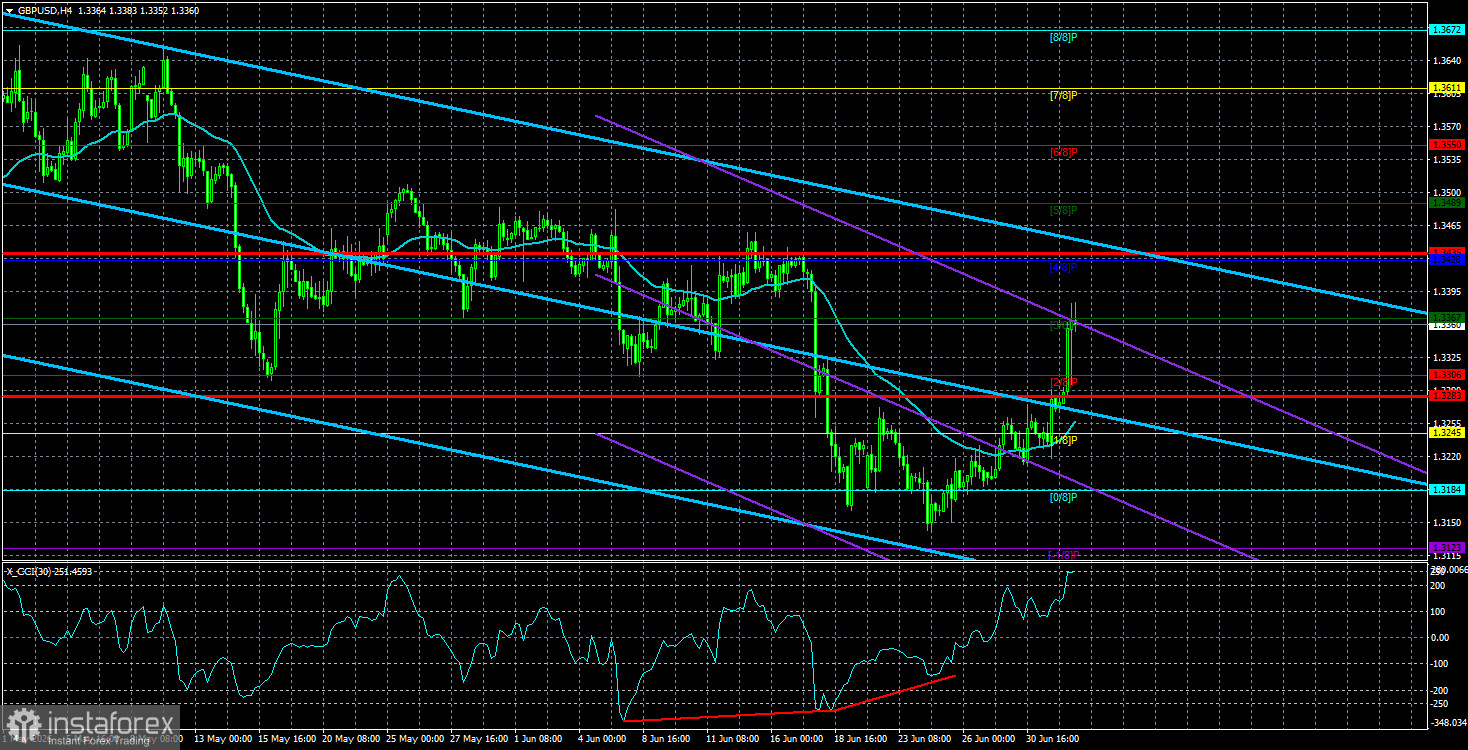
The average volatility of GBP/USD over the last five trading days is 76 points. For GBP/USD, this is considered "moderate." On Friday, July 3, we therefore expect movement within a range bounded by 1.3283 and 1.3435. The higher linear regression channel is pointing downward, indicating a bearish trend. The CCI indicator entered oversold territory twice and formed two bullish divergences, signaling a possible end of the downtrend.
Nearest support levels:
- S1 – 1.3306
- S2 – 1.3245
- S3 – 1.3184
Nearest resistance levels:
- R1 – 1.3367
- R2 – 1.3428
- R3 – 1.3489
Trading recommendations:
The GBP/USD currency pair maintains a bearish trend. Donald Trump's policy will continue to put pressure on the U.S. economy, so we do not expect long-term dollar strength. 2026 is currently shaping up to be a very positive year for the dollar due to geopolitics and the Fed's readiness to raise interest rates. However, on the weekly timeframe, a sideways range between 1.3150 and 1.3780 remains within a four-year upward trend. Long positions with targets at 1.3428 and 1.3489 can be considered when price is above the moving average. When price is below the moving average, short positions are relevant with a target at 1.3123.
Explanation of charts:
- Linear regression channels help identify the current trend. If both point in the same direction, the trend is strong.
- Moving average (settings 20,0, smoothed) determines the short-term trend and trading direction.
- Murray levels are target levels for movements and corrections.
- Volatility levels (red lines) indicate the expected price range over the next 24 hours based on current volatility.
- CCI indicator: readings below -250 (oversold) or above +250 (overbought) signal a potential trend reversal.


