


















Analysis of EUR/USD 5M
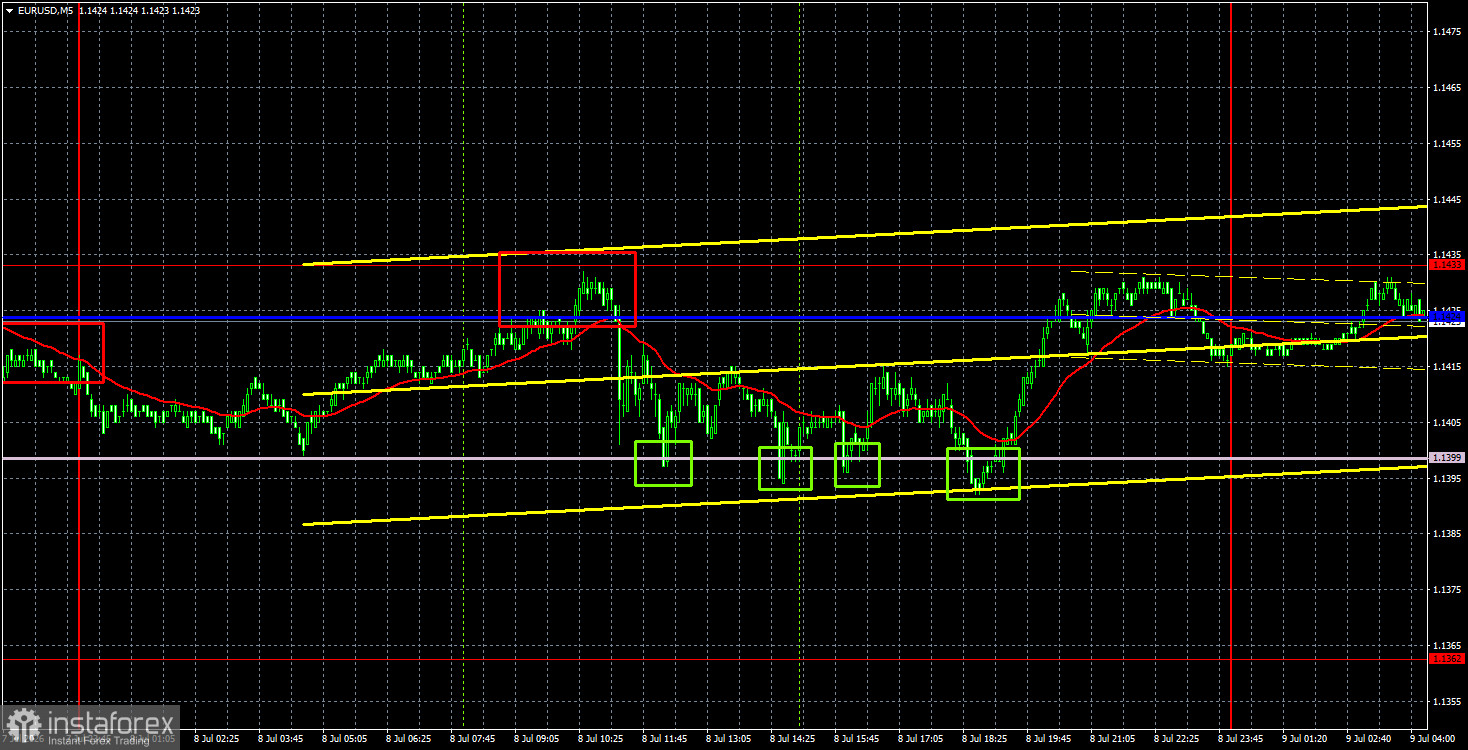
The EUR/USD currency pair continued to trade with minimal volatility and no clear direction on Wednesday. The hourly timeframe clearly shows that the entire last wave of growth was 120 pips over two weeks. The entire last wave of decline was 50 pips over the course of a week. Thus, the market currently has no desire to open new positions and move the pair in a definite direction. If yesterday had been sometime in March or April, we would surely have seen a powerful rise in the dollar. Iran and the US exchanged strikes and mutual accusations of violating the ceasefire and disrupting negotiations, after which the US president revoked his approval for the sale of Iranian oil, announced new strikes on Iran, and reported the end of negotiations with Tehran and the ceasefire regime in the Persian Gulf. The market did not react at all to these geopolitical upheavals. If the dollar did increase, it was minimal. Traders no longer pay attention to the latest shelling, missile launches, strikes on commercial vessels, the completion or resumption of negotiations, the conclusion or violation of ceasefires, and so on.
From a technical standpoint, the upward trend persists, but the euro currency is still growing extremely weakly. The trend line was broken, but the Senkou Span B line held firm. We do not see clear reasons for a new rise in the US dollar, but that does not mean the market does not have the right to buy the American currency.
On the 5-minute timeframe on Wednesday, five trading signals were generated with a total volatility of less than 40 pips. It is clear that with such volatility, even 25 signals would not bring significant profit. The price bounced four times off the Senkou Span B line and once from the 1.1424-1.1433 area. Therefore, traders could only open two positions, both of which were profitable.
COT Report
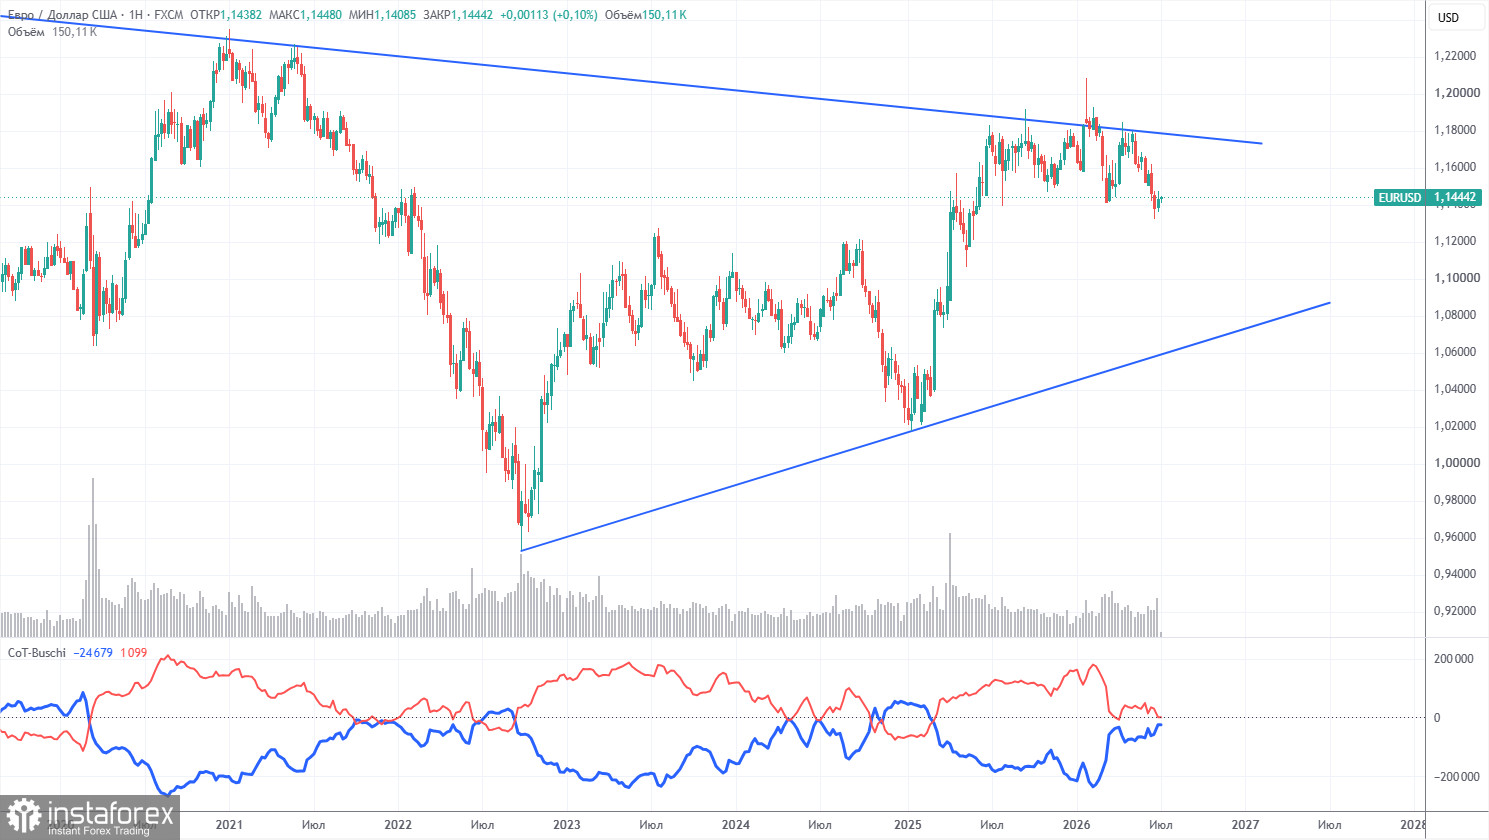
The latest COT report is dated June 30. The weekly timeframe illustration clearly shows that the net position of non-commercial traders remains "bullish" but has declined significantly due to geopolitical events. Traders have been getting rid of the euro in favor of the US dollar in recent months. Donald Trump's policy has not changed, but for a time the dollar acted as a "reserve currency." However, this process may already have been completed.
We still do not see any fundamental factors to strengthen the euro, yet there are sufficient factors for the decline of the American currency. The war in the Middle East has made the dollar temporarily super-attractive, but once this factor's "shelf life" expires, everything will return to normal. And it may have already expired. In the long term, the euro could fall to the level of $1.08 (the trend line), but the upward trend will still remain relevant. Moreover, over the past months of dollar growth, the pair has not come significantly closer to this line.
The positioning of the red and blue lines of the indicator indicates parity between bulls and bears. Over the last reporting week, the number of longs in the "Non-commercial" group decreased by 11,700, while the number of shorts increased by 17,400. Accordingly, the net position decreased by 29,100 contracts over the week.
Analysis of EUR/USD 1H
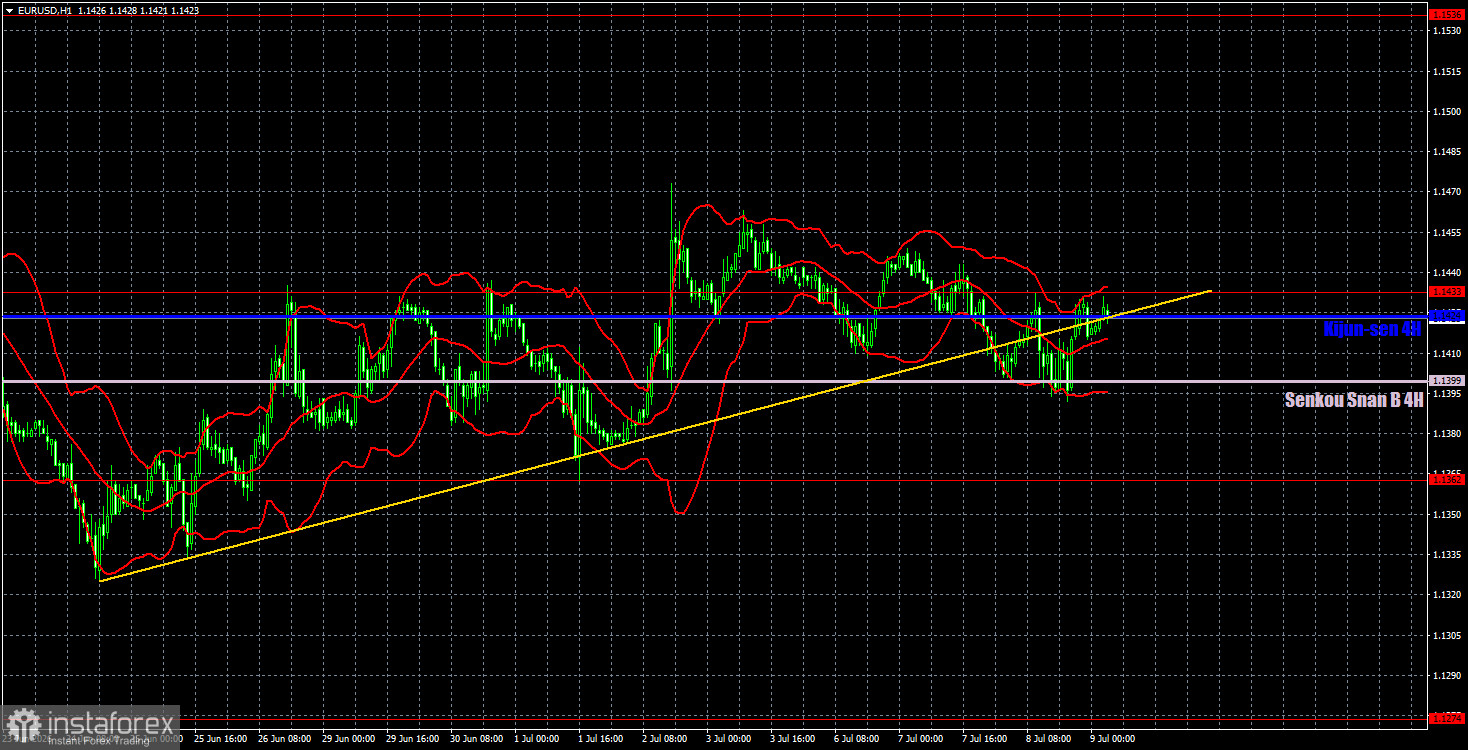
On the hourly timeframe, a corrective upward trend continues within a two-month downward trend. The situation in the Middle East remains tense, but we do not believe that new strikes by Iran and the US, or uncertainty in negotiations and deals, provide sufficient grounds for a further strengthening of the dollar. The market continues to ignore all factors favoring the euro.
For July 9, we highlight the following levels for trading — 1.1234, 1.1274, 1.1362, 1.1433, 1.1536-1.1542, 1.1585, 1.1657-1.1666, 1.1750-1.1760, 1.1786, 1.1830-1.1837, as well as the Senkou Span B line (1.1399) and the Kijun-sen line (1.1424). The Ichimoku indicator lines may move during the day, which should be taken into account when determining trading signals. Do not forget to set the Stop Loss order to break even if the price moves in the right direction by 15 pips. This will protect you from potential losses if the signal proves false.
On Thursday, there will be no more important macroeconomic and fundamental events. Today in Germany, a report on the trade balance, imports, and exports will be released, while in the US, new home sales and unemployment claims data will be published. We regard all five reports as secondary and do not expect any market reaction to them.
Trading Recommendations:
Today, traders may consider short positions with targets at 1.1399 and 1.1362 if the price bounces from the 1.1424-1.1433 area. Long positions can be opened if the price consolidates above the 1.1424-1.1433 area, with a target of 1.1536-1.1542. Volatility remains weak.
Explanations for Illustrations:
Price levels of support and resistance (resistance/support) are thick red lines around which movement may terminate. They are not sources of trading signals.
The Kijun-sen and Senkou Span B lines are Ichimoku indicator lines carried over to the hourly timeframe from the 4-hour timeframe. They are strong lines.
Extremum levels are thin red lines from which the price has previously bounced. They are sources of trading signals.
Yellow lines represent trend lines, trend channels, and any other technical patterns.
Indicator 1 on the COT charts indicates the size of the net position of each category of traders.


