


















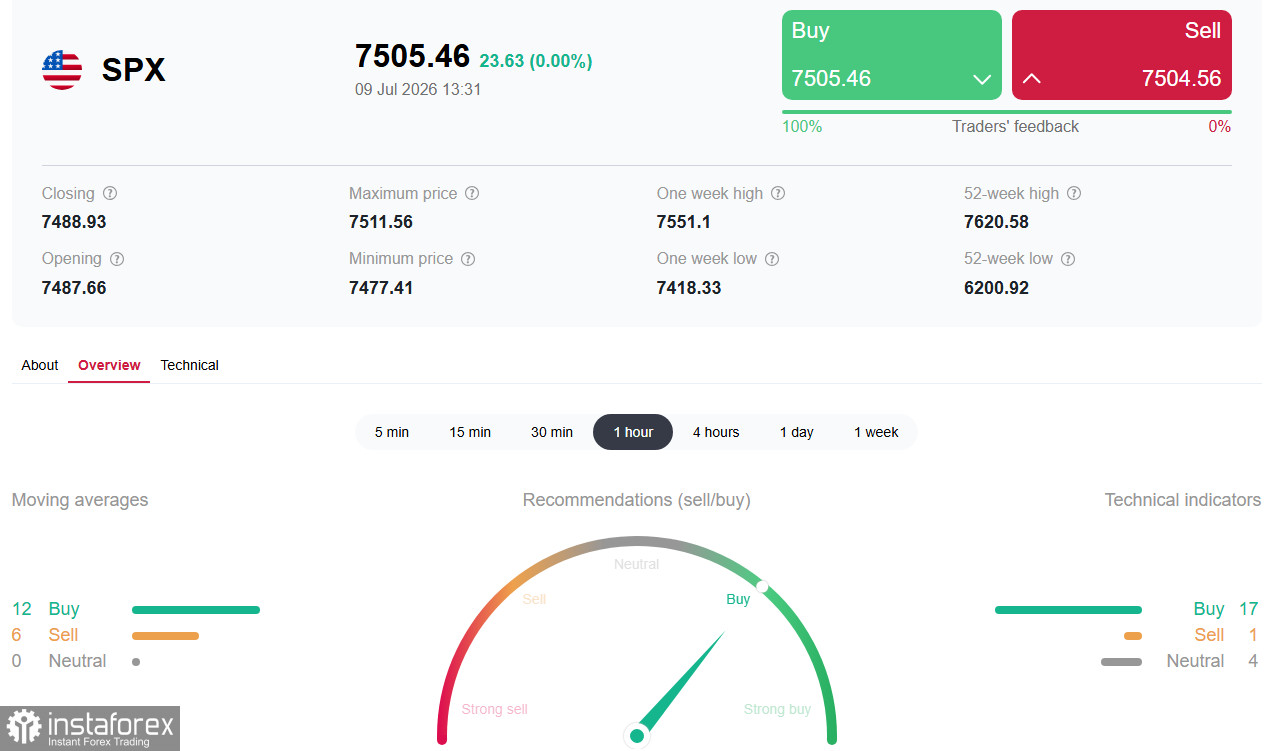
*See also: InstaForex trading indicators for S&P 500 (SPX)
The S&P 500 closed Wednesday down 0.3% at 7,467.00, caught between renewed geopolitical escalation and hawkish signals from the Federal Reserve. US President Donald Trump's statement that the ceasefire with Iran has ended pushed Brent above $80/bbl and revived inflation concerns. The index displayed broad divergence: nine of 11 sectors finished in the red, while energy and technology were the only gainers, supported by rising oil and sector-specific semiconductor news.
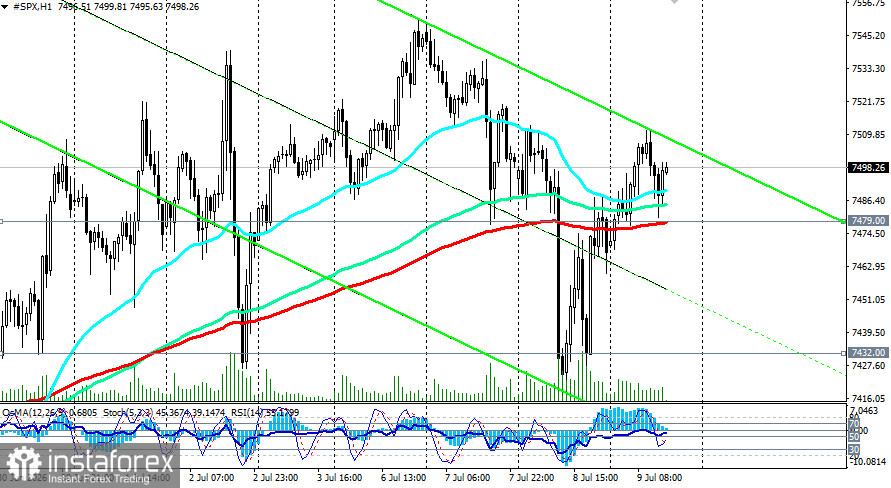
In early Thursday trade and ahead of the US opening bell, S&P 500 futures (SPX) are attempting to recover, up about 0.3% and trading near 7,500.00. Markets are being supported by stabilizing oil prices and a technical rebound in tech after reports that China may allow leading AI firms to buy a limited number of Nvidia H200 chips. Nevertheless, economists warn that the stagflationary backdrop persists: higher energy prices can re-accelerate inflation and force the Fed into faster tightening.
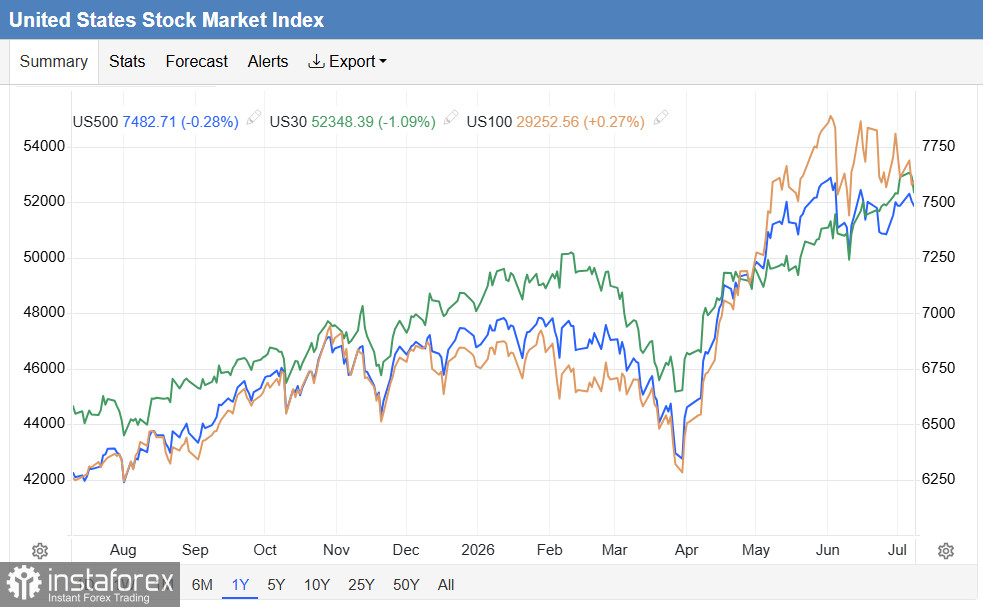
Fundamental backdrop: hawkish FOMC minutes and sectoral divergence
FOMC minutes confirm dissent
The June FOMC minutes published on Wednesday revealed widening disagreement among officials during Kevin Warsh's debut meeting as chair. Several participants saw grounds for a rate hike as early as June, yet ultimately all 12 FOMC members voted unanimously to maintain the target range at 3.50–3.75%. The minutes noted that upside risks to price stability remain elevated, while downside risks to the labor market have eased somewhat.
Sectoral divergence intensifies
On Wednesday, nine out of 11 S&P 500 sectors closed lower. Materials (-2.49%), financials (-1.92%), and real estate were the weakest performers, while energy (+1.45%) and technology (+1.44%) outperformed. As Deutsche Bank observed, this pattern reflects a stagflationary environment in which equities suffer on both sides of the Atlantic, and the chip-stock moves have diverged sharply from the broader market.
Technical snapshot
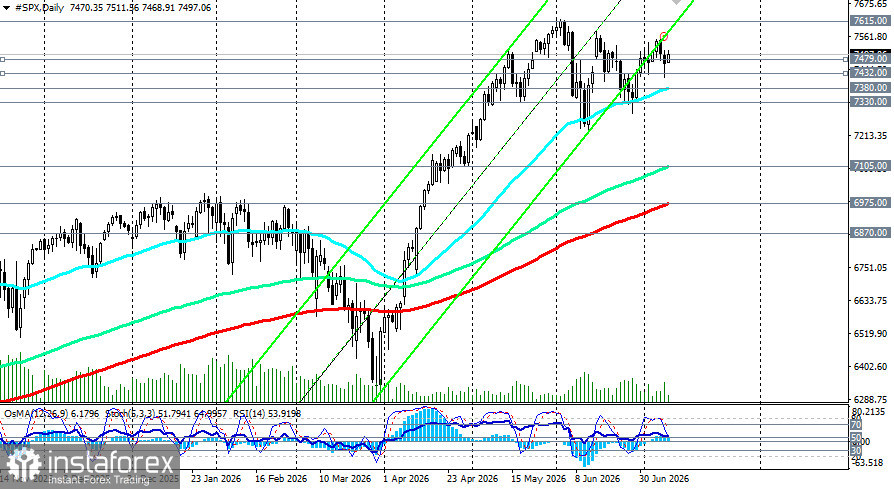
From a technical perspective, the S&P 500 is trading in a consolidation phase within the ranges of 7,430.00–7,550.00 and the broader 7,380.00–7,600.00, balancing between bullish and bearish signals.
The index is trading above the 50-period EMA (7,380.00) and the 200-period EMA (6,975.00), which supports the view that the medium-term uptrend remains intact. However, price action is consolidating near the upper boundary of a symmetrical triangle, implying the potential for either an upside breakout or a return to the support level.
- RSI (14) on the daily chart sits in neutral territory (just above 50), indicating neither overbought nor oversold conditions with a mild bullish tilt.
- OsMA and Stochastic are mixed: OsMA remains bullish but shows waning momentum; Stochastic has exited overbought territory and is moving toward the oversold zone without yet entering it.
Key levels
- Immediate resistance: 7,550.00 and 7,600.00.
- Immediate support: 7,479.00 (200-EMA on the 1-hour chart), 7,432.00 (200-EMA on the 4-hour chart), 7,400.00, 7,380.00 (50-EMA on the daily chart).
*See also: S&P 500 (SPX): scenario outlook for July 9, 2026
Overall, the technical picture supports an intact uptrend, but mixed oscillator readings and proximity to the key 7,600.00 resistance level increase the probability of a correction.
Key events to watch
| Date | Event | Forecast / Expectation | Expected impact on S&P 500 |
| July 9 | Weekly initial jobless claims | — | Strong print = pressure on market; weak = support |
| July 14 | US inflation data (CPI) | — | Rising inflation = pressure; slowing = support |
| During the week | Geopolitical developments | — | Escalation = pressure; de?escalation = support |
Conclusion and recommendations for investors
The S&P 500 sits at the intersection of a stagflationary backdrop and growing sectoral divergence. Hawkish FOMC minutes and renewed geopolitical escalation create uncertainty, but a still-robust technology complex and hopes for upbeat inflation prints may cap downside.
Bank forecasts diverge:
- BofA remains corrective on Q3 and flags a potential move to 7,120–6,970.
- Tom Lee of BitMine is bullish, projecting the S&P 500 to 8,000 within the year, citing market re-rating and strong corporate profits.
For short-term traders: prioritize shorts on a break below 7,470 with targets at 7,380–7,280. Consider longs only on a confirmed close above 7,530–7,540 together with supporting fundamentals.
For medium-term investors: adopt a wait-and-see stance into the July 14 CPI print and for clarity on geopolitics. A pullback toward 7,380–7,300 can be used to add long exposure, provided structural supports remain in place (solid earnings, ongoing AI investment).
Risk management: remain cautious given elevated volatility. Use stop-loss orders and monitor geopolitical developments and US inflation data closely.


