


















Analysis of EUR/USD 5M
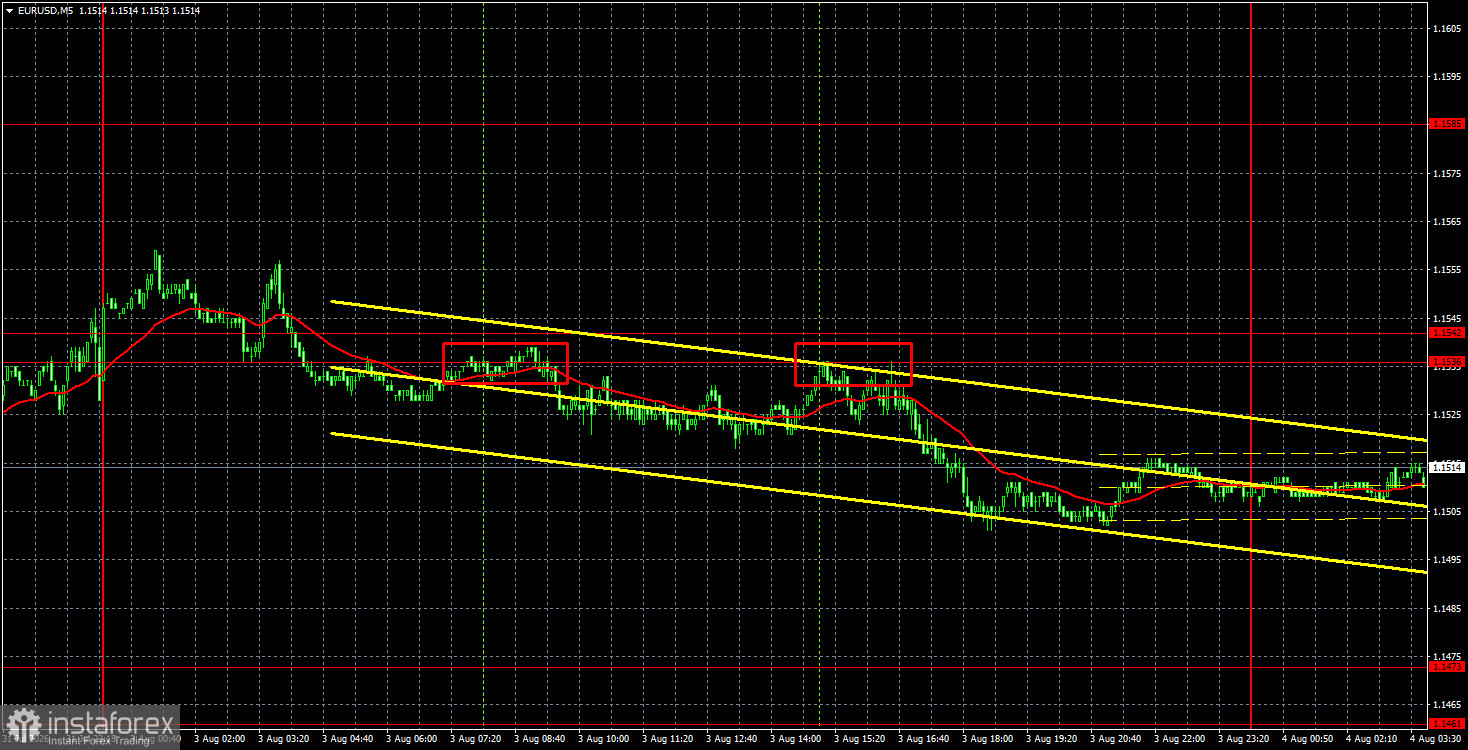
The EUR/USD currency pair slightly corrected on Monday after its second unsuccessful attempt to break through the 1.1536-1.1542 range. Last week, the European currency showed explosive growth long anticipated. Recall that for over a month, the pair had been stuck within a sideways channel, while the U.S. dollar had been rising for a total of 2.5 months, often without justification. The spring was tightening, and we repeatedly noted that, technically, fundamentally, and geopolitically, there were no grounds for the dollar's continued growth. The technical picture is best observed on higher timeframes, where there is no sign of growth in the American currency at all. There is only a yearly flat that would have ended long ago if it were not for the war in the Middle East. Yesterday, the only significant event in the world was the ISM Manufacturing Index in the U.S. This index came in above forecasts, prompting a slight strengthening of the dollar. However, traders understand well that the prospects for the American currency now depend on labor market data. If they turn out weak again, it is far from certain that the Federal Reserve will move towards tightening monetary policy in September.
Technically, the pair has exited the sideways channel of 1.1362-1.1461 after a month of turmoil. Traders can now expect not only an upward trend but a full-fledged trend. Recall that over the past year, the EUR/USD pair has mainly moved sideways, and there are still no strong grounds for a long-term dollar trend.
On the 5-minute timeframe on Monday, two sell signals were formed. First during the European session, then during the American session, the price rebounded from the 1.1536-1.1542 area, allowing traders to open short positions. By the end of the day, the trade could be closed with a profit of about 20 pips. Alternatively, a Stop Loss could have been set at breakeven, and the trade rolled over to Tuesday.
COT Report
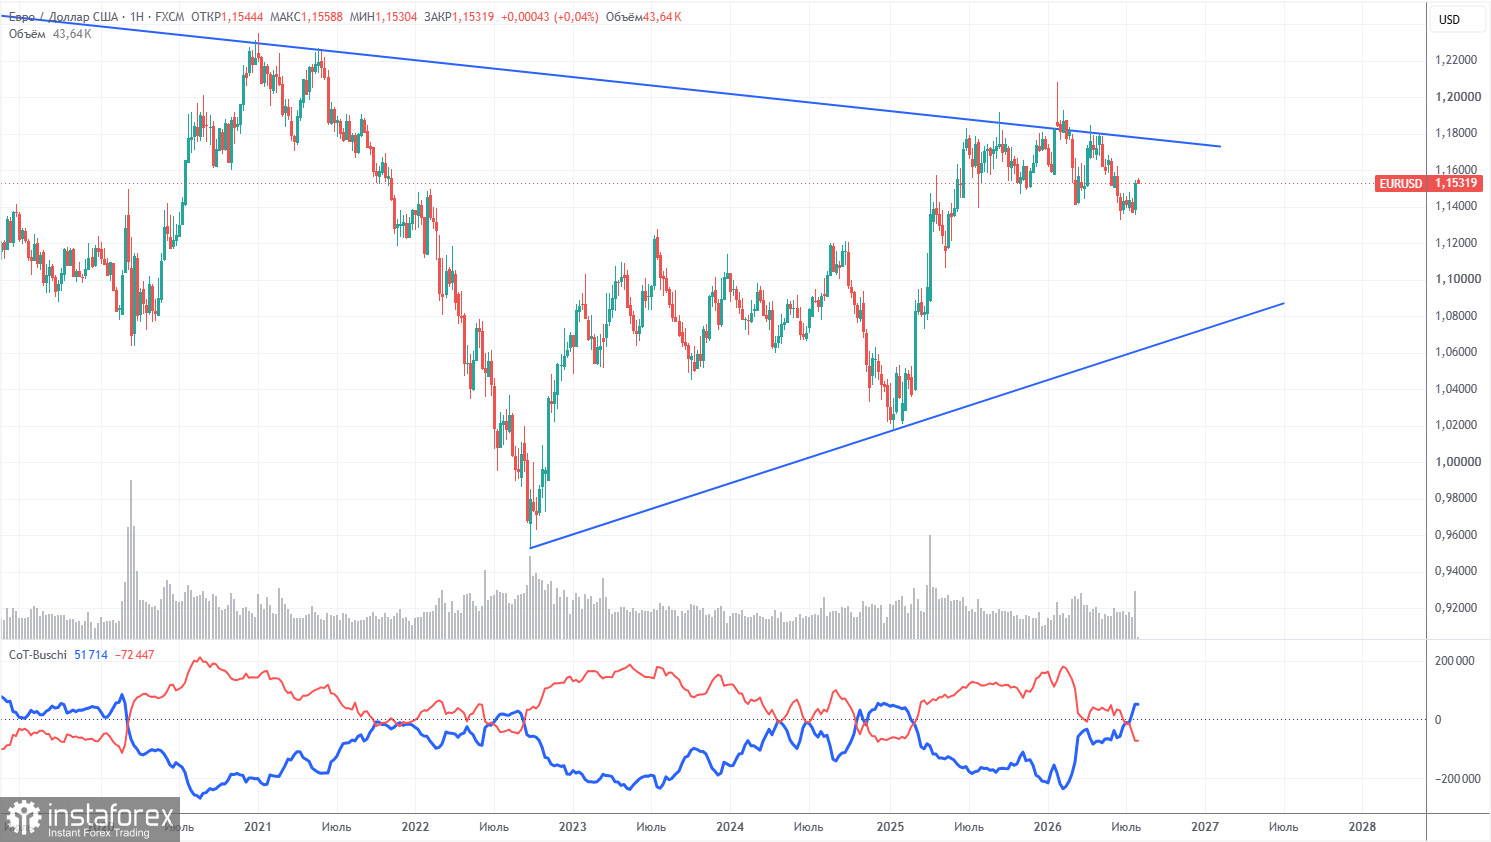
The latest COT report is dated July 28. In the weekly timeframe illustration, it is clear that the net position of non-commercial traders has turned "bearish" and has significantly decreased in 2026 due to geopolitical events. Traders have been getting rid of the European currency in favor of the U.S. dollar in recent months. Donald Trump's policy has not changed, but for a time, the dollar acted as a "reserve currency."
We still do not see any fundamental factors to strengthen the European currency, but there remain enough factors for the U.S. dollar to decline. The war in the Middle East made the dollar temporarily super-attractive, but once this factor reaches its "expiration date," everything will return to its previous state. In the long run, the euro could fall to the level of $1.08 (the trend line), but the upward trend will still remain relevant. Over the past months of dollar growth, the pair has not approached this line much.
The position of the red and blue lines of the indicator indicates parity between bulls and bears. During the last reporting week, the number of longs in the "Non-commercial" group decreased by 15,500, while the number of shorts increased by 15,600. Accordingly, the net position decreased by 31,100 contracts over the week.
Analysis of EUR/USD 1H
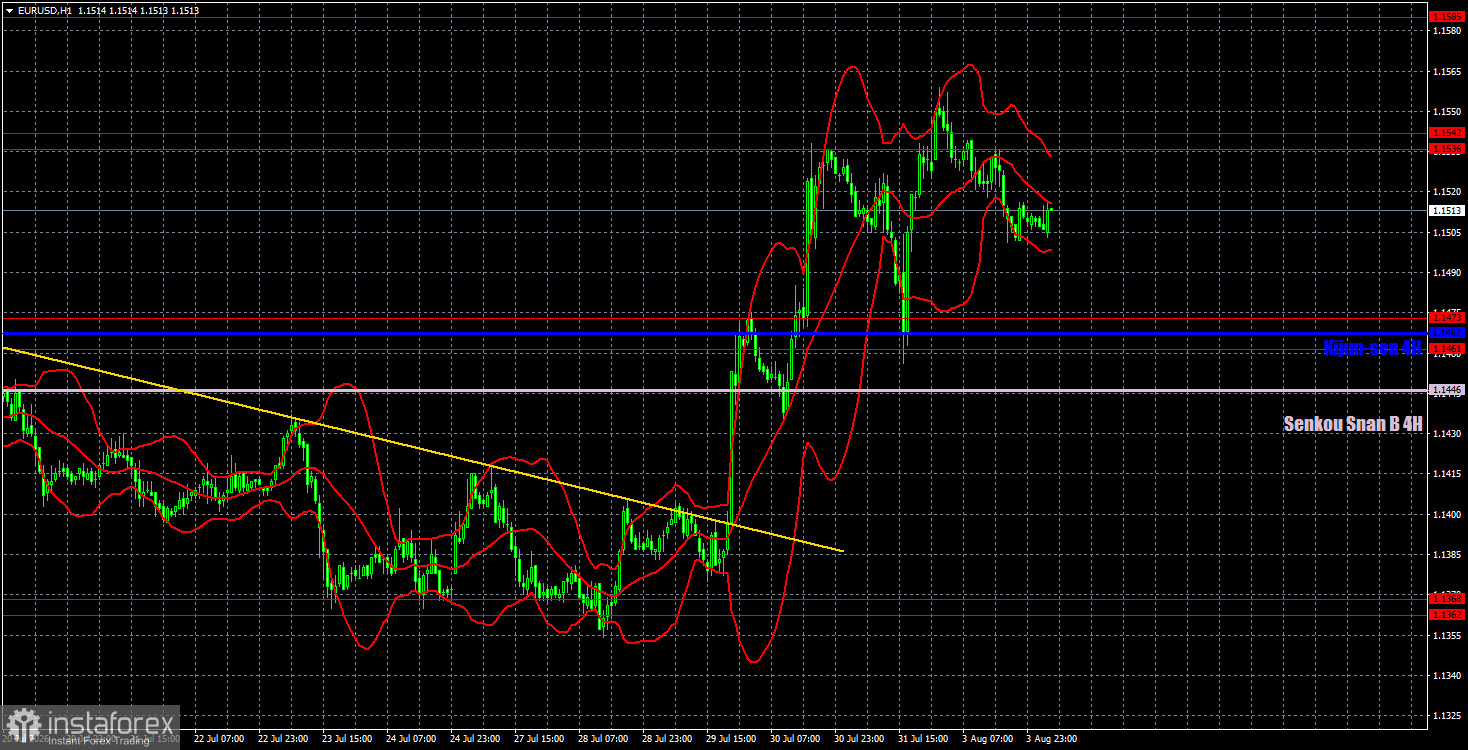
On the hourly timeframe, the pair has resumed an upward trend after a month-long pause. The situation in the Middle East remains tense and has not improved, but this is insufficient for a new, powerful rise of the dollar. The market has ignored all positive news for the euro in recent months and has focused solely on the Fed's monetary policy, which it has had inflated expectations of. If the situation has now changed, the European currency has the opportunity to reflect on all past news/events/reports that the market has ignored.
For August 4, we identify the following levels for trading: 1.1234, 1.1274, 1.1362-1.1368, 1.1461-1.1473, 1.1536-1.1542, 1.1585, 1.1657-1.1666, 1.1750-1.1760, 1.1786, 1.1830-1.1837, as well as the Senkou Span B line (1.1446) and Kijun-sen line (1.1467). The Ichimoku indicator lines may move during the day, and this should be taken into account when determining trading signals. Don't forget to set a Stop Loss at breakeven if the price moves in the correct direction by 15 pips. This will protect against potential losses if the signal proves false.
On Tuesday, the macroeconomic calendar in Germany and the Eurozone is empty, while in the U.S., the not-so-important JOLTs report on open job vacancies will be released. This report is indirectly related to the U.S. labor market but is a lagging indicator and not particularly significant.
Trading Recommendations:
Today, traders may remain in short positions with a target of 1.1461-1.1473, as the price rebounded yesterday from the area of 1.1536-1.1542. A consolidation above the area of 1.1536-1.1542 will allow for the opening of new long positions with targets of 1.1585 and 1.1657-1.1666.
Explanations for the Illustrations:
- Support and resistance price levels are shown by thick red lines, around which the movement may end. They are not sources of trading signals.
- The Kijun-sen and Senkou Span B lines are lines from the Ichimoku indicator transferred from the 4-hour timeframe to the hourly. They are strong lines.
- Extremum levels are indicated by thin red lines, from which the price has previously bounced. They are sources of trading signals.
- Yellow lines indicate trend lines, trend channels, and any other technical patterns.
- Indicator 1 on the COT graphs shows the size of the net position of each category of traders.


