


















According to a new VanEck report, Bitcoin's approach to a cyclical bottom fits well with the picture sketched just recently by CryptoQuant, which recorded a drop in the share of profitable coins to 51.4%, the lowest since early 2023. The firm uses its own GEO model to assess the market, tracking global liquidity, leverage within the crypto ecosystem and on-chain activity. Currently, global liquidity and on-chain activity are in a neutral zone, while the leverage situation is assessed as constructive.

The report's key thesis is that the current decline from roughly $125,000 to the $58,000–63,000 area is not a structural market break, but a normal part of the four-year cycle tied to the halving. "These cycles are a feature of the market, not a structural break," the VanEck note says. The company's CEO Jan van Eck has previously made a similar point publicly, calling the situation a classic slumping fourth year of the cycle — after three years of gains Bitcoin then experiences a large decline — and adding that the hard cap on issuance at 21 million coins together with the reduction in miner rewards remains the main driving force of this dynamic, which, he said, is often overcomplicated by attempts to find new explanations.
VanEck names energy and infrastructure as a separate driver of future growth, since the expansion of the AI sector is creating huge demand for electricity and grid modernization — a theme that directly echoes the previously described pivot of mining companies toward servicing data centers instead of pure Bitcoin extraction.
Trading recommendations
Bitcoin
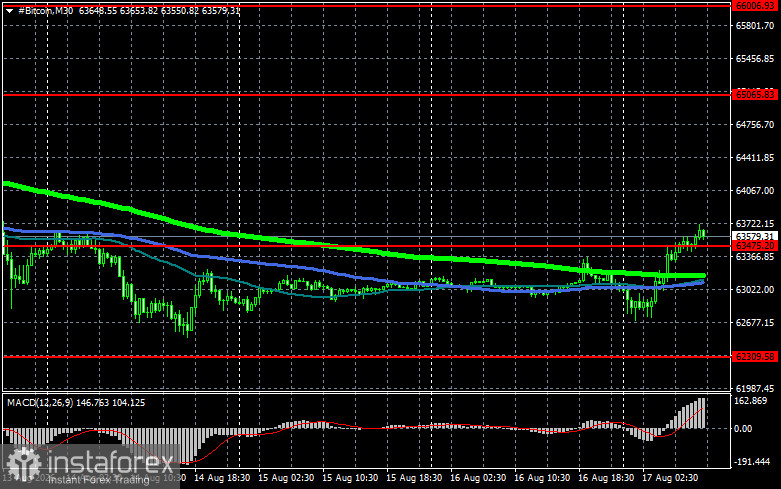
Buyers are now targeting a return to the $65,000 level, which opens a direct path to $66,000, and from there to $66,800; a break above that would signal attempts to restore the bull market. If Bitcoin falls, buyers are expected at $63,400. A return of the trading instrument below this area could quickly drop BTC toward $62,300. The farthest target would be the $60,600 area.
Ethereum
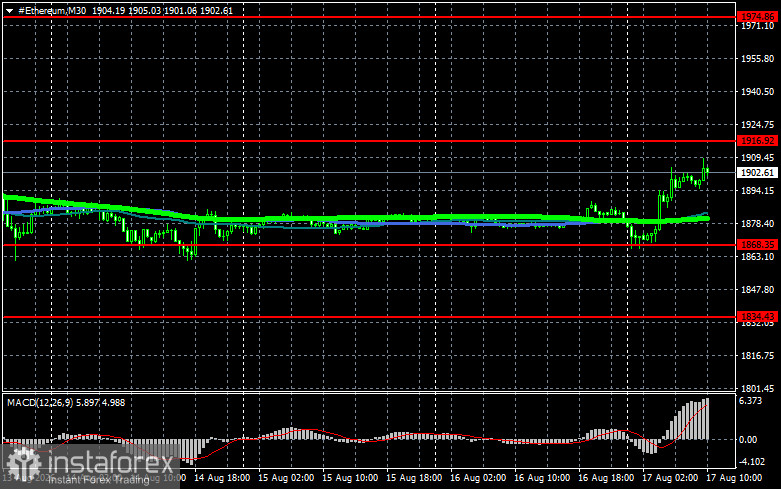
A clear hold above $1,916 opens a direct path to $1,974. The farthest target is the high around $2,012; a break above that would indicate strengthening bullish market sentiment and a return of buyer interest. If Ethereum falls, buyers are expected at $1,868. A return of the trading instrument below this area could quickly push ETH toward $1,834. The farthest target would be the $1,782 area.
What's on the chart
- The red lines represent support and resistance levels, where the price is expected to either pause or react sharply.
- The green line shows the 50-day moving average.
- The blue line is the 100-day moving average.
- The lime line is the 200-day moving average.
Price testing or crossing any of these moving averages often either halts movement or injects fresh momentum into the market.


