


















Friday's US labor market data appeared to finish off those still clinging to the thesis that crypto would rally on a Fed pause. Yet, under the surface of the rates market, the picture is calmer than Bitcoin's price action suggests.

The CME FedWatch Tool currently prices a roughly 58% chance of a 25?bp hike in September to 3.75–4.00%, essentially the same odds traders had priced a week earlier, well before Friday's releases. That divergence is telling: market participants with real money at stake have not rushed to repricing, while social?media chatter and some analysts have swung more hawkish. That contrast—muted rates arithmetic versus dramatic Bitcoin moves—suggests the recent sell?off is more an emotional overshoot and corrective necessity than a rational repricing of macro risk.
Is a September hike already baked in? Not yet. A 58% probability is a persistent likelihood, not a certainty, and it can fall quickly if the August inflation prints on September 11 come in softer than expected. It is that CPI report—not Friday's payrolls—that now functions as the decisive catalyst ahead of the Fed's September meeting.
From this setup flows a straightforward logic for Bitcoin over the coming week. A weak CPI on September 11 can drive prices back toward recent highs, because it will remove the hawks' main argument and vindicate those pricing only a modest chance of a hike. Hot inflation, by contrast, will give the Fed formal grounds to tighten and will hit Bitcoin harder than the current pullback to the $78,700–79,400 area, because it will reprice not only expectations but also actual odds on the CME FedWatch. Thus, the inflation print—not headlines—will likely set Bitcoin's near?term direction through the Fed decision on September 16.
Technical outlook
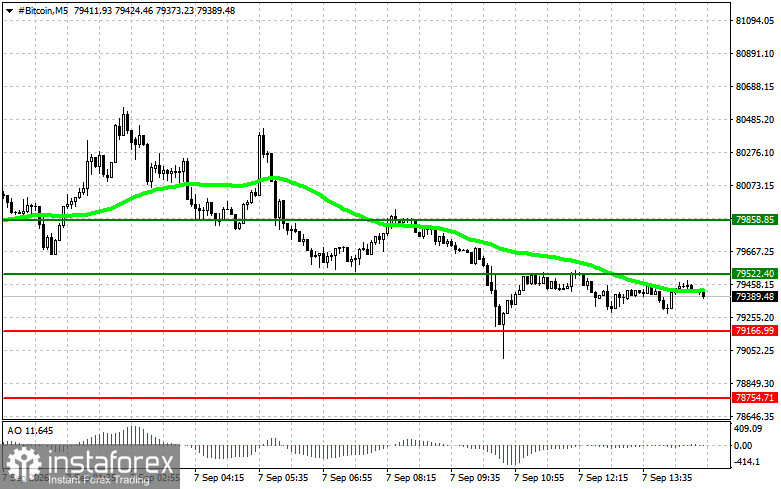
Bitcoin is balancing today in a narrow corridor between $79,100 and $79,800, and the trading plan for the day is built around two opposing scenarios: a breakout and a rejection at the range edges. If the price reaches the $79,500 area and attempts an upside breakout, I will open a long with a target at $79,800, take profit there, and then flip to a short on a possible pullback, since sharp moves after breakouts often peter out at the nearest resistance. Before entering such a trade, it is important to check two conditions at once: the 50?day moving average must remain below the current price, confirming a bullish medium?term context, and the Awesome Oscillator must be above the zero line, signaling buyer momentum rather than a fading move.
The second long scenario is the opposite: if the price falls to the lower boundary at $79,100 but the market shows no conviction on a break below, that can be read as a false move, and one may enter a long from that level with a target back to $79,500 and then $79,800.
Shorts on Bitcoin are mirror images of the longs, only inverted. Upon reaching $79,100 and confirming a downside break, I will sell with a target at $78,700, and there I will look for a point to reverse into a long on the bounce, since declines and advances rarely continue without a correction immediately after the first significant target. The entry condition here is also double: the 50?day average must be above price, confirming a bearish context, and the Awesome Oscillator must move into negative territory. The second short scenario assumes a rejection off the upper boundary at $79,500 without follow?through on an upside break, which opens the way to short toward both lower targets, $79,100 and $78,700, in sequence.
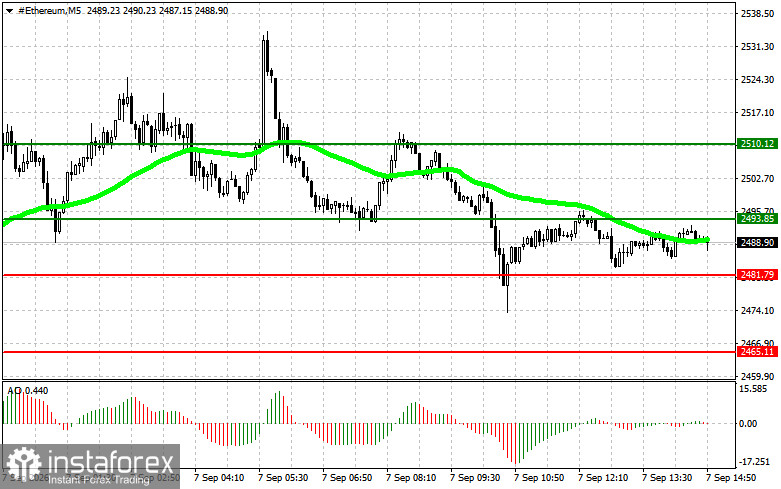
Ether trades in a slightly narrower range today, $2,475–2,510, but the trade logic is identical to Bitcoin's, scaled to Ether's price levels. Breakout buys are considered from $2,493 with a target at $2,510, where the plan calls for profit taking and an immediate short on the pullback; enter this trade only with the same filters in place—the 50?day MA below price and the Awesome Oscillator above zero. An alternative long entry is possible at the lower boundary, $2,481, if a break below shows no conviction, with the same targets of $2,493 and $2,510.
Ether shorts begin at $2,481 with a target at $2,465, and the plan likewise calls for exiting the short and immediately buying any ensuing bounce. The short entry condition is the mirror of the long: the 50?day MA must be above the current price and the Awesome Oscillator must be negative. The second short variant is to sell on a failed upside breakout above $2,493, which opens the path to both lower targets in sequence.
Note that both indicators—the moving average and the Awesome Oscillator—are intended as filters to cut false signals, not as standalone entry triggers. Trades should be opened only on real price confirmation at the designated levels, not preemptively based solely on the indicators' current readings.


