


















Bitcoin passed the August CPI release almost unscathed, holding around $77,000–78,000 despite the headline index confirming consensus at 3.4% year-on-year and 0.4% month-on-month, while the core measure unexpectedly accelerated to 0.3% month-on-month versus the expected 0.2%, even though the annual core rate slowed to 2.4%, the lowest since 2021. That mix of a cooling year-on-year base and an accelerating monthly pace produced a mixed signal for the market rather than an unambiguously negative one, which helps explain the asset's resilience where a sharp sell-off might have been expected.

The main culprit behind the unpleasant surprise in the report was gasoline, which rose 3.9%. This is directly linked to rising oil prices, which now trade around $108 per barrel, amplifying inflationary pressure through the energy component of the index regardless of what happens with core inflation. The chain is straightforward: expensive oil feeds CPI via gasoline, a hot CPI strengthens hawkish Federal Reserve arguments, and a stronger hawkish stance squeezes the risk assets that would benefit most from looser policy.
The probability of a 25 bp hike at the September 15–16 meeting rose to 87.1%. Recall that in July the committee already voted 9–3 to hold the rate, with three dissenters favoring a hike — a sign the Fed's hawkish wing has been gaining influence with each meeting.
In my view, Bitcoin's resilience to hot inflation data and expensive oil so far reflects not market confidence in a benign outcome but rather fatigue from the steady stream of macro shocks in recent weeks. I do not rule out that this calm may be deceptive: crypto upside will be extremely limited in the coming days until the Fed decision on September 16, and if a hike is confirmed, the market will likely be forced to sharply reprice recent gains, including attempts to sustain levels above $80,000, which in all likelihood will be postponed until monetary-policy clarity emerges.
As for short-term trading, the strategy and conditions are described below.
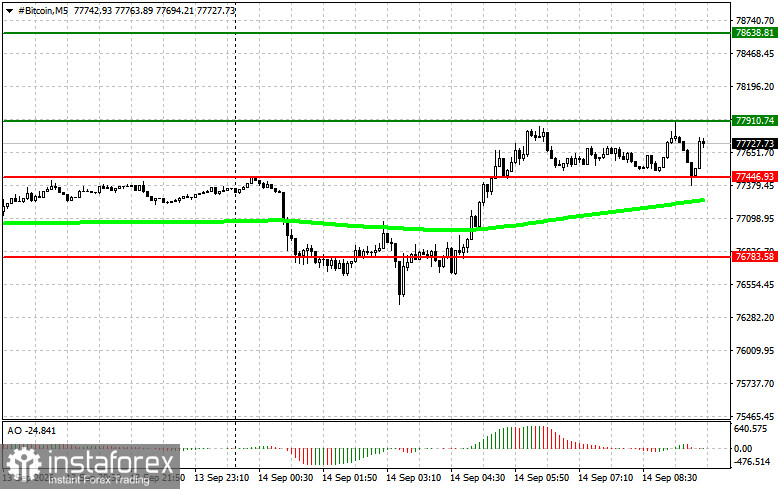
Amid Fed decision anticipation, Bitcoin holds in a $77,400–78,600 range, and the trading plan is built around four scenarios in each direction. A breakout above $77,900 opens a buy position toward $78,600, where profit should be taken, and a reversal into a short on a possible pullback should be considered. The entry condition is mandatory: price must remain above the 50-day moving average, and the Awesome Oscillator must be in positive territory. The second buy variant works on a rebound: if price approaches the lower boundary at $77,400 but a breakdown is not confirmed, treat it as a false spike and open a long position targeting $77,900, then $78,600.
Shorts are arranged symmetrically. A confirmed break below $77,400 leads to a short targeting $76,700, with opposite conditions — the moving average above price and Awesome below zero. The second sell variant works on a rebound at $77,900; if an upside breakout is not confirmed, this opens the path for a short sequentially to $77,400 and then $76,700.
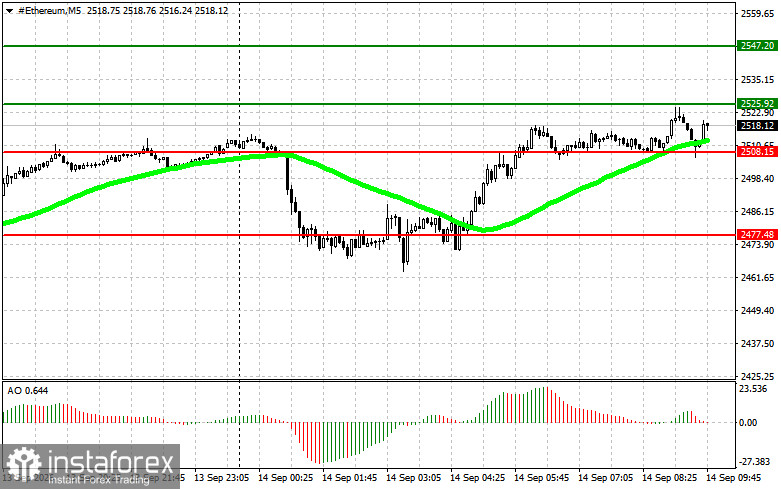
Ether trades in the $2,508–2,547 range, and the same logic applies to its price scale. A breakout above $2,525 signals a buy toward $2,547 under the same conditions — a rising moving average below price and Awesome above zero. The second long variant works on a rejection at $2,508; if a downside breakout is not confirmed, target a return first to $2,525 and then to $2,547.
Ether shorts start from a break below $2,508, targeting $2,477, with price below the moving average and Awesome in negative territory. The second sell variant works on a rejection at $2,525; if an upside breakout is not confirmed, the aim is to return to $2,508 and then to $2,477. Both indicators serve solely as filters to exclude false moves, not as independent reasons to enter early, so the decision is made only after price confirms the specified levels—especially given that the Fed decision can sharply expand volatility beyond the indicated ranges in either direction.


