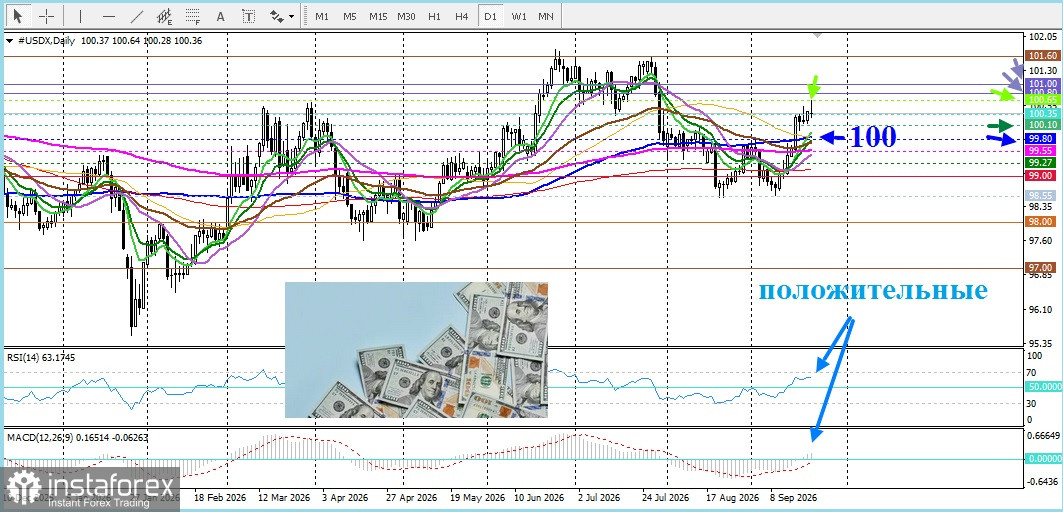
Today, Tuesday, the US dollar index (DXY), which tracks the greenback against a basket of currencies, is showing a modest pullback after reaching a new high since July 30. However, that advance has not yet found strong follow-through.
Last week, the Federal Reserve raised interest rates for the first time in more than three years, and the dot plot showed officials expect at least one more hike this year. Moreover, Boston Fed President Susan Collins and St. Louis Fed President Alberto Musalem have publicly advocated for further policy tightening as inflation risks remain elevated amid a surge in commodity prices. On top of that, geopolitical uncertainty tends to lift demand for the dollar as a traditional safe-haven asset, which should continue to support DXY in the near term.
Among recent developments, Iran's Islamic Revolutionary Guard Corps (IRGC) warned on Monday that it would change the geography of the war if the US escalates the conflict. At the same time, Washington is ramping up economic pressure on Iran, warning that Iranian airlines could lose access to international air routes from September 23. The dynamic is further complicated by renewed fighting between Iran-backed Houthis in Yemen and Saudi Arabia — all of which underpins a constructive near-term outlook for DXY.
At the same time, Iran offered to reopen the Strait of Hormuz within seven days if the US lifts its blockade of ports and ceases military actions. That optimistic signal pushed crude oil to a two-week low, easing inflation concerns and keeping government bond yields below multi-year peaks.
That, in turn, limits bulls' urge to open fresh long positions in the DXY, so caution remains warranted even against a favorable fundamental backdrop. Before declaring the index at a peak, traders should wait for a convincing continuation of any downward move.
From a short-term perspective, as long as the index holds above the 100-day simple moving average (SMA), it retains a bullish bias.
Key levels: nearest resistance on further upside is at 100.65, followed by a more significant band at 100.80–101.00, with a stronger resistance area near the recent local high around 101.60. On the downside, initial support is at 100.10, followed by the 100-day SMA and other key moving averages. Momentum oscillators remain positive, indicating bulls currently hold the edge.