


















Trade review for Tuesday:
1H chart of the EUR/USD pair
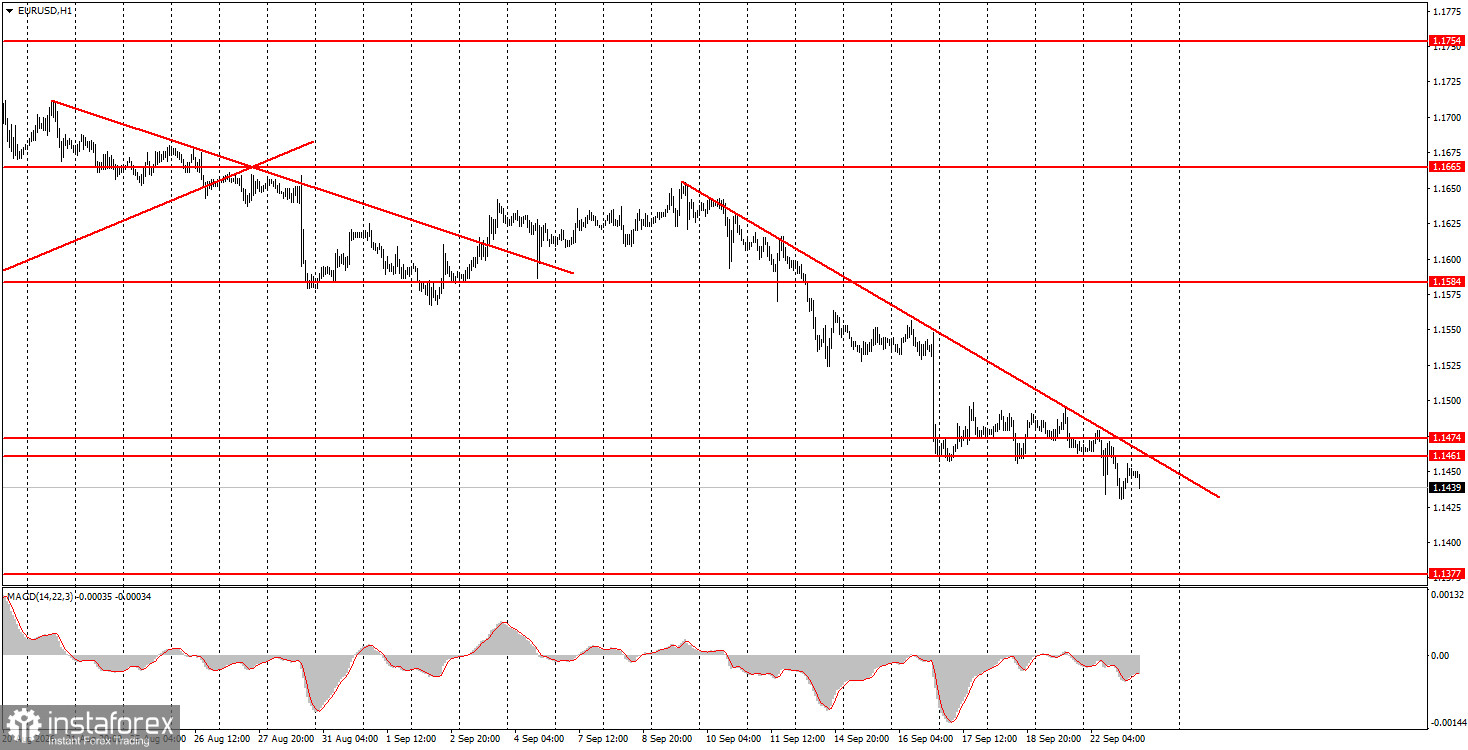
The EUR/USD pair unexpectedly resumed its downtrend on Tuesday. A fall within a downtrend isn't surprising, but the dollar has continued to strengthen and the euro to weaken for reasons that are hard to pin down. For example, no major events or releases occurred in the EU or the US on Monday or Tuesday. On what basis has the dollar been rising for a third consecutive week? Is the market still simply working through Federal Reserve tightening? Other explanations are scarce. Yes, a meeting between US and Iranian leaders may take place this week, but what are the real chances of ending the Middle East conflict? And if the war ends, that would be negative for a safe-haven dollar. Also, this week Trump is scheduled to meet Xi — but what precisely does the market expect from that meeting, and why would it support the dollar? We believe the current move is illogical and largely inertia-driven. Nevertheless, the trend line indicates the downtrend remains intact, so technically the decline is more coherent than a rally.
5M chart of the EUR/USD pair
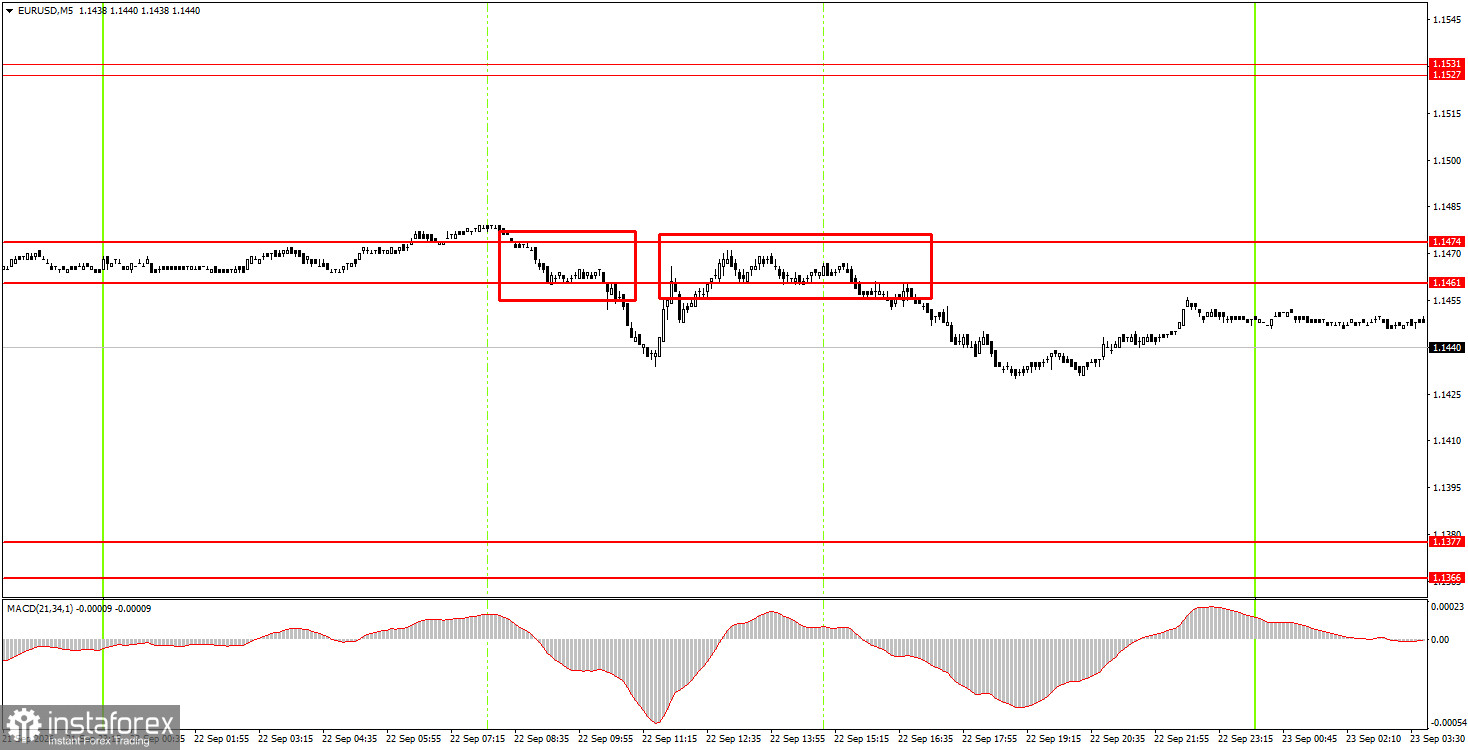
On the 5-minute timeframe on Tuesday, two sell signals formed. Price bounced twice from the 1.1461–1.1471 area, which provided novice traders opportunities to open short positions. Given the persistence of the downtrend on the hourly timeframe, further euro weakness is likely today.
How to trade on Wednesday:
On the hourly timeframe, the EUR/USD pair continues a downward trend that is now a full-blown trend. Given recent months' events, we don't think the euro will collapse like a stone, but the market's primary focus remains Fed policy, which has become significantly more supportive of the US dollar. That factor cannot support the dollar forever, but it still does for now.
On Wednesday, novice traders may open short positions targeting 1.1366–1.1377 if price bounces off 1.1461–1.1474. Open long positions targeting 1.1527–1.1531 if price closes and holds above 1.1461–1.1474.
On the 5-minute timeframe, monitor levels 1.1267–1.1275, 1.1366–1.1377, 1.1461–1.1474, 1.1527–1.1531, 1.1584–1.1594, 1.1655–1.1665, 1.1745–1.1754. On Wednesday, Germany, the euro area, and the US will publish September business-activity indices for manufacturing and services. Since no larger events are scheduled this week, these PMI releases will carry significance.
Key Rules of the Trading System:
- The strength of a signal is determined by the time it takes to form the signal (rebound or breakout). The less time taken, the stronger the signal.
- If two or more trades were opened at a certain level based on false signals, all subsequent signals from that level should be ignored.
- In a range (flat), any pair can generate many false signals or may not produce any at all. Technical levels may be disregarded.
- On the hourly timeframe, trading signals from the MACD indicator should be acted upon only when volatility is high, and a trend line or trend channel confirms the trend.
- If two levels are too close together (within 5-20 pips), treat them as a support or resistance area.
- After moving 15 pips in the right direction, a stop-loss should be set to break even.
What to Look for on the Charts:
Price levels (areas) of support and resistance serve as targets for opening buy or sell trades or as sources of signals.
Red lines indicate channels or trend lines that show the current trend and the preferred trading direction.
The MACD indicator (14,22,3) — the histogram and signal line — is an auxiliary indicator that can also provide signals.
Important speeches and reports (listed in the news calendar) can significantly influence currency pair movements. Therefore, during their release, traders should approach trading with utmost caution, or exit the market to avoid sudden reversals against the preceding move.
Beginner forex traders should remember that not every trade can be profitable. Developing a clear strategy and practicing money management are key to long-term success in trading.


