


















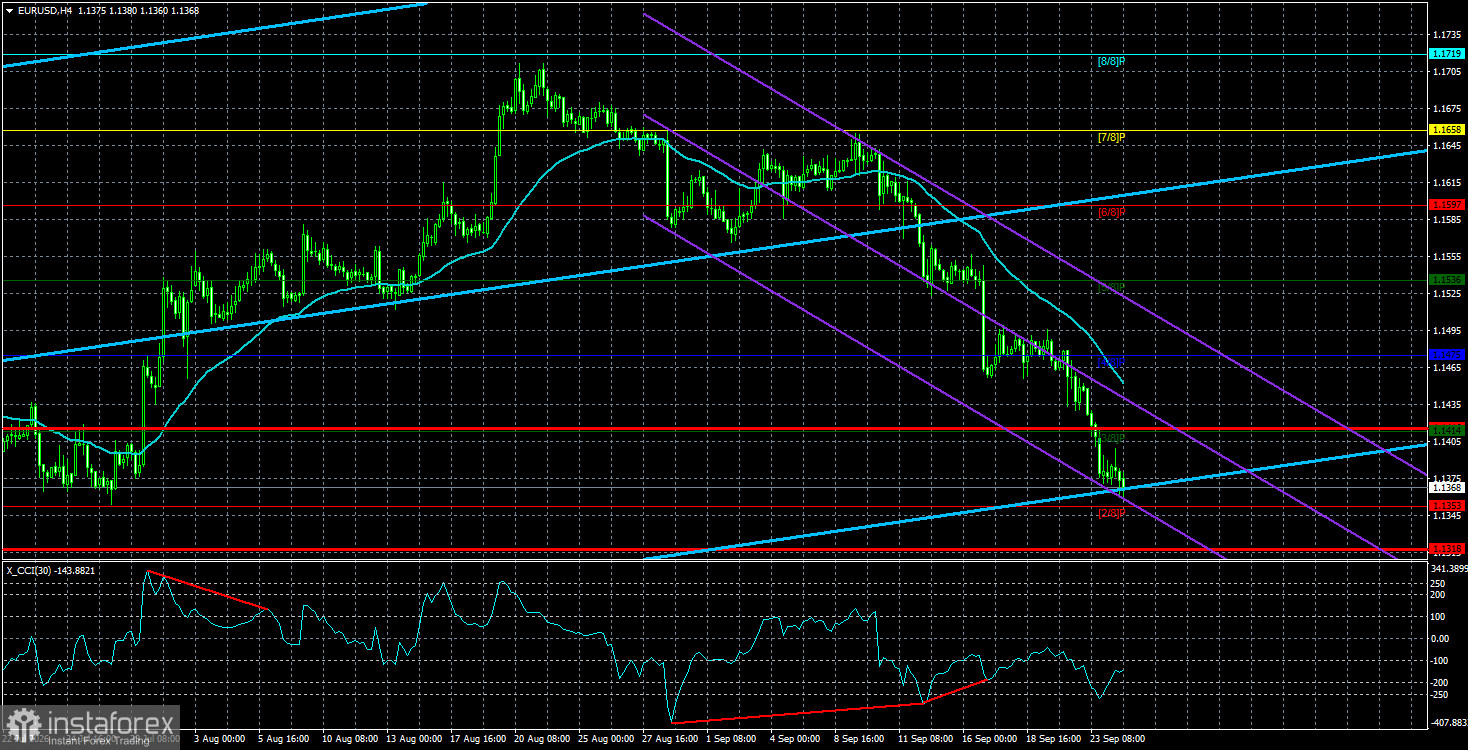
The EUR/USD pair continued its downward movement on Thursday, which by now probably surprised no one. Both this week and last week we repeatedly stated that the market keeps moving in a closed loop, pricing the same single factor — Federal Reserve monetary tightening. Moreover, the US dollar's rise now looks simply absurd. We do not deny that Fed rate expectations have indeed hardened in the past month, and that the Fed has shown readiness to raise the key rate several times. But how much longer will the dollar appreciate on one factor while the market ignores all other factors?
The most interesting thing is that most experts see nothing surprising in this movement. They find new explanations every day for exactly this behavior. It is done extremely simply: from the entire flow of news/events/releases, they pick the ones they need and draw the "correct conclusion" from them. For example, on Wednesday S&P business activity indices for September were published in the US. Both showed very high values, which indirectly point to an acceleration of the US economy, allowing the Fed to tighten policy more easily. Most experts immediately concluded that the dollar rose roughly 100 pips in a day precisely because of this factor. It does not matter that the US business activity indices were released when much of the move had already taken place. It does not matter that the US also publishes ISM business activity indices, which have no correlation with S&P indices and are considered more important. It does not matter that eurozone and German PMIs also exceeded forecasts that day. It does not matter that the European Central Bank has already tightened policy twice, yet only the US dollar is appreciating — and continuously. The main thing is to find a fitting explanation.
One must also note the geopolitical theme. Talks between Iran and the US have resumed, and it does not matter if they end in nothing again. There is no talk of escalation now, and there are even some hints of de-escalation and an end to the war. Recall that the dollar is a safe-haven asset used by capital during geopolitical shocks. So when geopolitics improves, demand for the dollar should fall, not rise. Yet this factor currently means nothing and worries no one.
Thus we stick to our view. The current decline of the pair is entirely inertial and illogical. From a technical standpoint, everything looks reasonable, and one can even trade it. But who predicted such a sharp, confident rise in the dollar three weeks ago? And explaining after the fact that the dollar rose by X pips for Y reasons is of little interest. On the market, forecasts matter most, not explanations of why a move happened. We believe that if a movement is illogical, it is better to skip it than to open positions without understanding why.
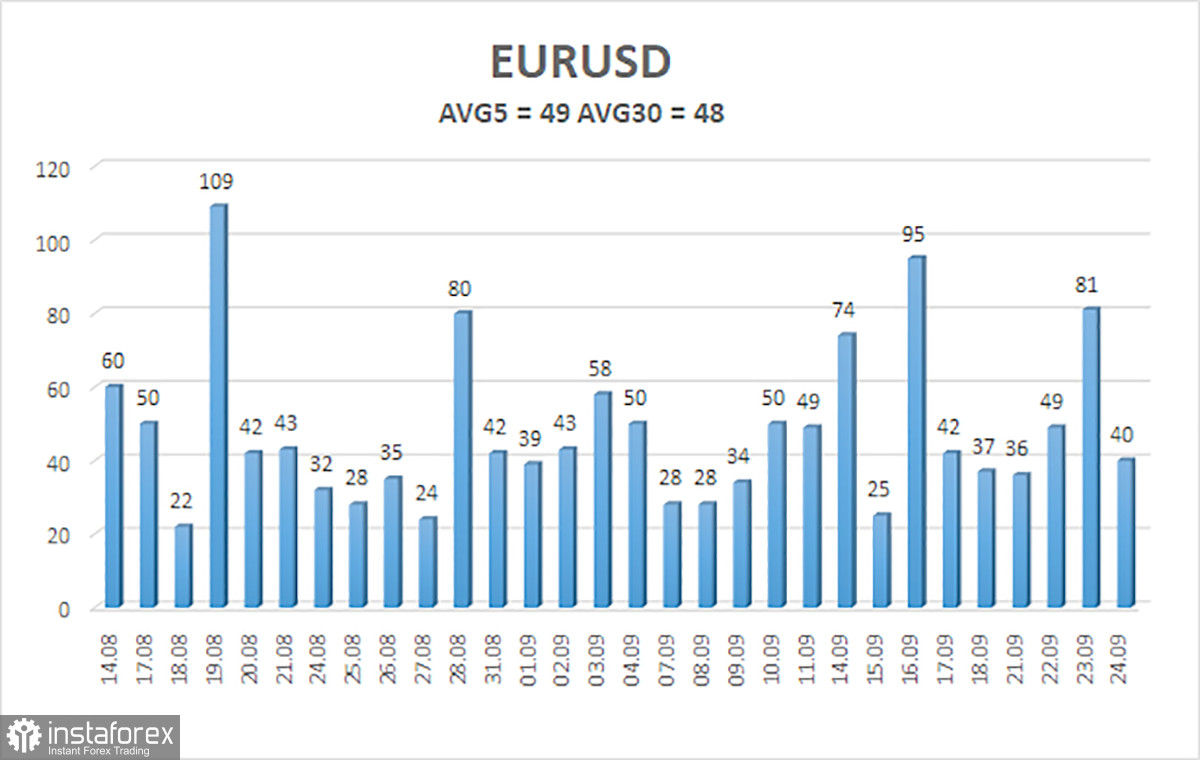
The average volatility of the EUR/USD currency pair over the last 5 trading days as of September 25 is 49 pips and is characterized as "average." We expect the pair to move between 1.1318 and 1.1416 on Friday. The upper linear regression channel is pointing upward, indicating an uptrend. The CCI indicator entered the oversold area three times and formed three "bullish" divergences, which warn of the end of the illogical downward correction. However, the market is not reacting to anything right now.
Nearest support levels:
S1 – 1.1353
S2 – 1.1292
S3 – 1.1230
Nearest resistance levels:
R1 – 1.1414
R2 – 1.1475
R3 – 1.1536
Trading Recommendations:
The EUR/USD pair continues to move downward, but we still view the decline as a correction before a new upward trend. The global fundamental backdrop for the dollar remains negative, but in 2026, geopolitics first, and then the Fed's hawkish stance, provided strong support to the US currency. When price is below the moving average, consider shorts with targets of 1.1353 and 1.1318. Above the moving average, long positions are relevant, with targets of 1.1475 and 1.1536.
Explanations for Illustrations:
Regression channels help determine the current trend. If both are directed in the same direction, it means the trend is currently strong;
The moving average line (settings 20,0, smoothed) defines the short-term trend and the direction in which trading should be conducted at present;
Murray levels are target levels for moves and corrections;
Volatility levels (red lines) are the probable price channel within which the pair will spend the next 24 hours based on current volatility indicators;
The CCI indicator – its entry into the oversold area (below -250) or the overbought area (above +250) indicates that a trend reversal in the opposite direction is approaching.


