


















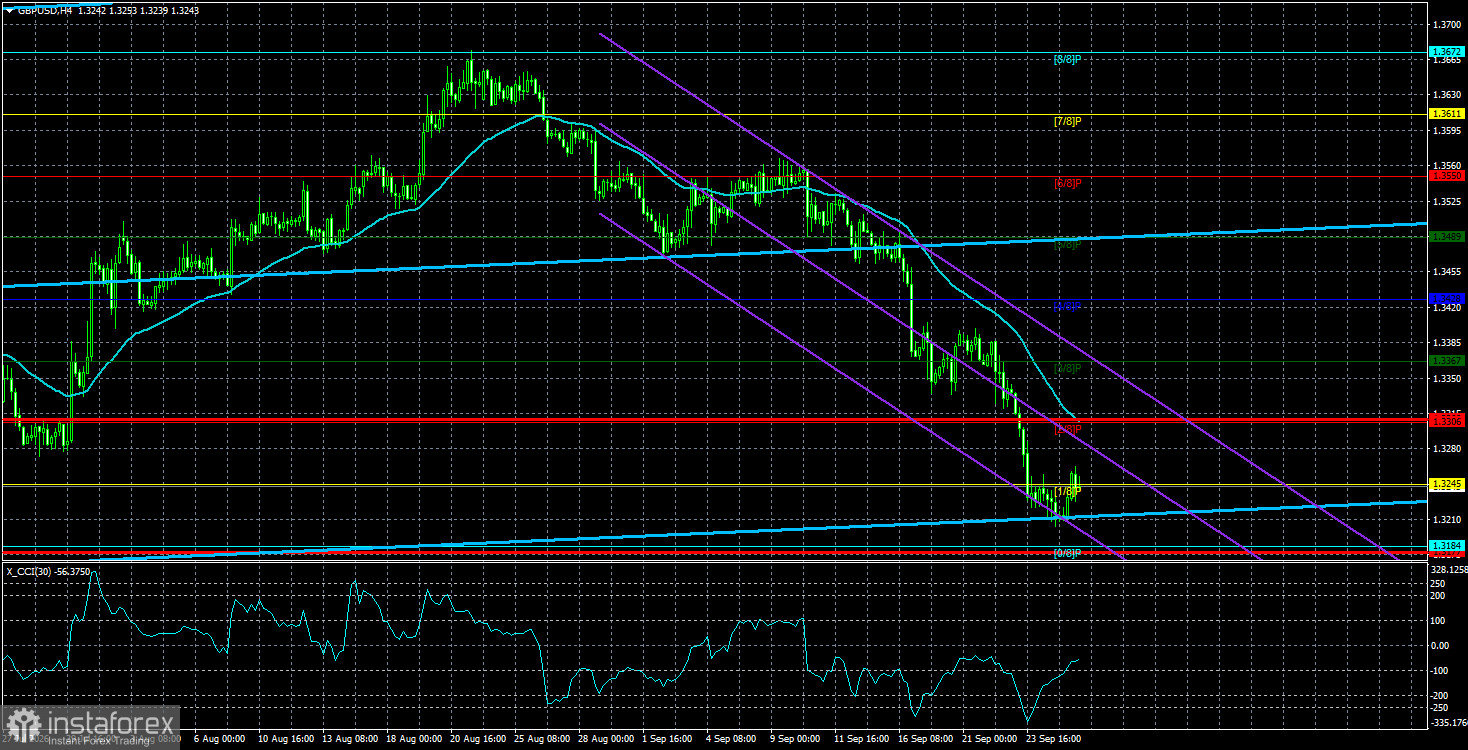
The GBP/USD pair also corrected slightly on Friday, but overall the outlook for the pound remains murky. Even if the Bank of England raises the key rate today, we doubt the market would start buying sterling. Unfortunately, the market currently sees only the dollar and only those factors that support it. All other factors are ignored. Thus, the market may continue to price Federal Reserve tightening for another couple of months. And who can prevent it?
We should also remind readers that no leading experts expected the dollar to strengthen at the start of the year. Yes, Donald Trump made his adjustments by starting a war in the Middle East, but at the same time the geopolitical factor has long ceased to influence market sentiment the way it once did. The market cannot trade on the same Iran-US conflict for years. Trump also helped trigger US inflation, forcing the Fed to raise the key rate. But that factor is already priced in. Today world-renowned experts keep repeating the same mantra: "The dollar rises on the Fed's hawkish tilt and monetary-policy prospects." In principle, that phrase can now be used at any time to explain any dollar rise.
No major events are scheduled in the UK this week, but the market doesn't need them right now anyway. The BoE is preparing to tighten policy at the end of 2026 and the start of 2027, but that factor currently has no market significance. Therefore, the UK economy's performance in August and September also does not matter.
In the US, a whole series of labor and unemployment reports will be released this week, most of which are also of little consequence. We draw traders' attention only to the Nonfarm Payrolls and the unemployment rate on Friday. Also important is the ISM manufacturing index, due Thursday. If that index again prints above forecasts, it would indirectly indicate a healthy US economy and give the Fed a "green light" to continue tightening. A few words about the Fed's "favorite inflation measure," the PCE index: core PCE could rise to 3.4% year-on-year, which would again indirectly argue for continued rate increases. However, the market has already priced in a fifth rate hike. Second, inflation may continue to rise if Trump keeps imposing new tariffs, raising existing ones and provoking conflicts worldwide. Inflation now depends more on Trump's actions than on the Fed. And the Fed may end up chasing inflation like a rabbit with a carrot tied to its back.
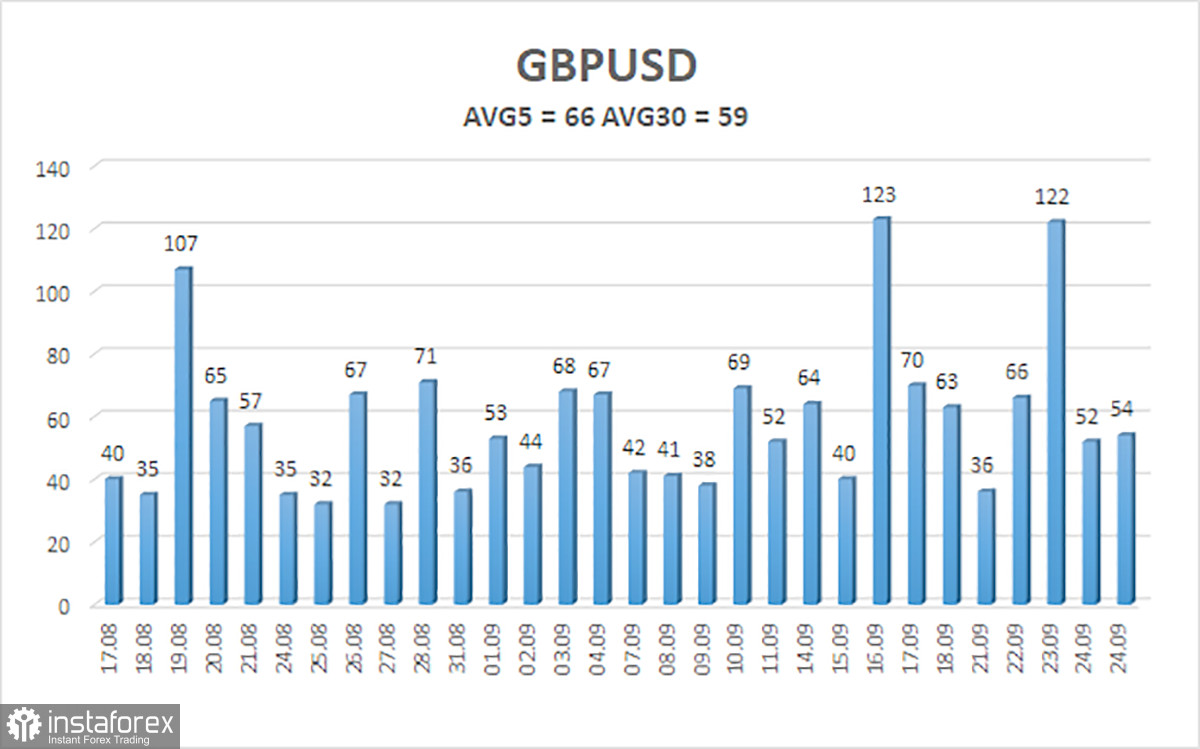
The average volatility of the GBP/USD pair over the last 5 trading days is 66 pips. For the pound/dollar pair, this value is characterized as "average." On Monday, September 28, therefore, we expect movement within the range bounded by 1.3177 and 1.3309. The higher linear regression channel is pointing upward, indicating an uptrend. The CCI indicator has entered the oversold area twice, warning of a possible end to the downward trend.
Nearest support levels:
S1 – 1.3184
S2 – 1.3123
S3 – 1.3062
Nearest resistance levels:
R1 – 1.3245
R2 – 1.3306
R3 – 1.3367
Trading Recommendations:
The GBP/USD pair continues its illogical downward movement. Trump's policies will continue to pressure the US economy, so we do not expect long-term gains from the US dollar. 2026 has been positive for the dollar so far due to geopolitics and inflation, which forced capital to seek refuge and prompted the Fed to return to tightening monetary policy. However, on the weekly timeframe, a flat range between 1.3150 and 1.3780 persists within a four-year uptrend, supporting expectations of pound appreciation in the medium term. Consider long positions with targets of 1.3428 and 1.3489 when price is above the moving average. Price below the moving average allows downside trading, with targets of 1.3184 and 1.3177.
Explanations for Illustrations:
Regression channels help determine the current trend. If both are directed in the same direction, it means the trend is currently strong;
The moving average line (settings 20,0, smoothed) defines the short-term trend and the direction in which trading should be conducted at present;
Murray levels are target levels for moves and corrections;
Volatility levels (red lines) are the probable price channel within which the pair will spend the next 24 hours based on current volatility indicators;
The CCI indicator – its entry into the oversold area (below -250) or the overbought area (above +250) indicates that a trend reversal in the opposite direction is approaching.


