


















Bitcoin has completed a local flat and broken out into open space. As we warned, the new leg up began without warning and without any specific major event. The market started buying the "digital gold" again as part of another pump. The only precedents for the new rise were two liquidity grabs to the upside on the 4-hour timeframe. On the daily timeframe, the downtrend structure can be considered broken, since the CHOCH line was decisively breached. A correction may begin soon, because the bearish FVG from the previous trend has been filled. At the same time, we draw attention to the sideways channel the price left. Despite a fairly strong close above the channel, this can still be a plain deviation.
Meanwhile, crypto expert Ray Dalio warned investors that a debt crisis could occur within 2–3 years. He believes market participants should diversify bond-related risks and pay more attention to gold as a more stable asset and to Bitcoin, which can protect against inflation. In Dalio's view, the Treasury's decision to increase bond buybacks indicates a serious crisis is approaching. By the way, this Treasury move did not reduce US bond yields, so the problem is, in essence, unresolved. Dalio also believes the US financial position is at a point where it may soon be too late to take effective action. Debts will grow to such a level that dealing with them will be possible only at the cost of severe shocks.
Dalio urged the US government to cut spending and raise tax revenues, and he urged the Federal Reserve to lower interest rates. He warned not to miss the current window while the economy still feels well, because later it will require government stimulus, which will again increase spending. According to Dalio, investors should soon reorient toward Bitcoin and safe-haven assets, as that combination will provide returns while reducing risks.
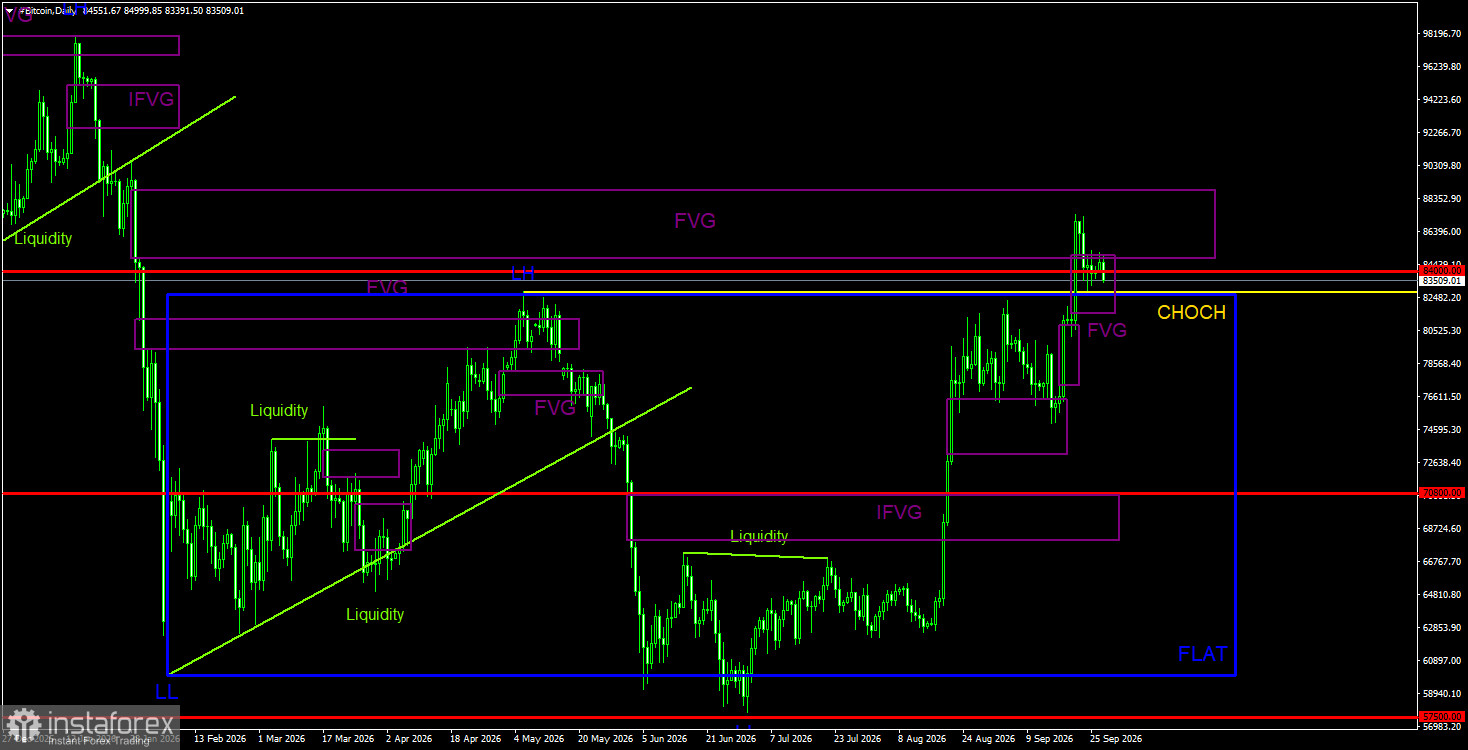
BTC/USD Daily Overview
On the daily timeframe, the downtrend structure is broken, so "digital gold" has likely begun forming a new bullish trend. The price has already filled the bearish FVG from the previous trend, so we expect a downward correction. Note that the recent Bitcoin rally, like the mid-August rise, shows all the signs of a pump. The breakout from the sideways channel $60,000–82,500 may still be a deviation. The price is currently supported by a bullish FVG in the $81,500–89,000 range. If that pattern is invalidated, the deviation scenario will be confirmed.
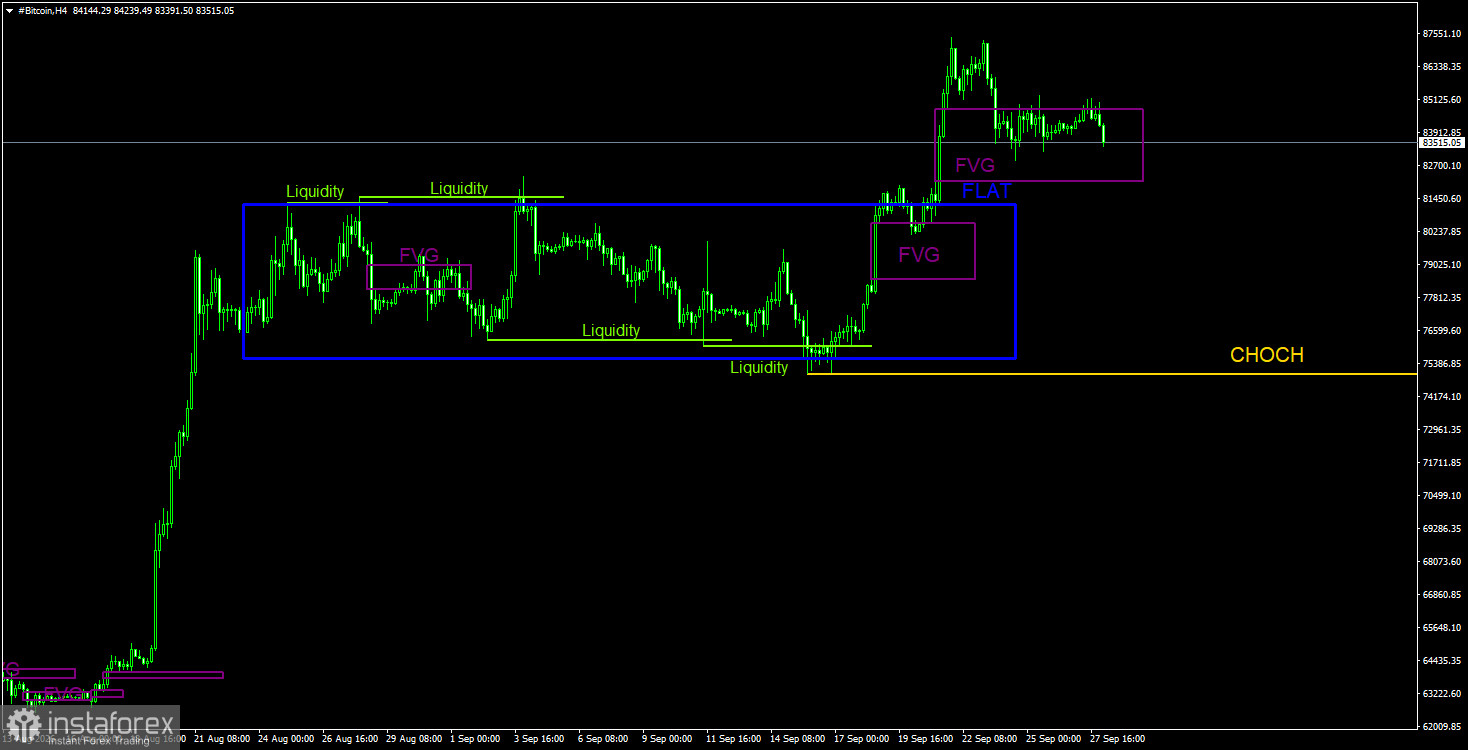
BTC/USD 4H Overview
On the 4-hour timeframe, Bitcoin left the bounds of the sideways channel. Four deviations formed inside that channel, the last two being bullish. Traders could have worked the last move from the channel's lower boundary to its upper one, and now the flat can be considered complete. From nearby areas of interest, we can only highlight the last bullish FVG, but there has been no reaction to it so far. On the daily timeframe, the picture is the opposite — Bitcoin reacted to the bearish pattern and therefore may start falling. The CHOCH (change of character) line on the 4-hour timeframe is around $75,000. Below that level, the uptrend can be considered finished.
Trading Recommendations for BTC/USD
Bitcoin shows all the signs of the start of a new bullish trend. This trend begins, as usual, with a pump that lacks a clear fundamental reason. The Fed has not started cutting rates, and the Clarity Act bill was not passed. In the near term on the daily timeframe, Bitcoin may decline, since the price reacted to the bearish FVG. Also note that the current breakout above the daily channel could be a deviation — albeit a deep one. If so, Bitcoin could still fall back toward $57,500. On the 4-hour timeframe, you can consider long positions from the last bullish FVG locally, but no confirmed signal has formed in that pattern yet. A potential long signal will need confirmation on the M30 timeframe in the form of a break of the short-term down structure and bullish patterns completing.
Explanations for the illustrations:
CHOCH – change of trend structure.
Liquidity – liquidity, Stop Losses, pending orders that market-makers use to accumulate positions.
FVG – Fair Value Gap. A price area of inefficiency. Price passes through these areas quickly, indicating the absence of one side in the market. Subsequently, price tends to return and react to such areas in continuation of the main trend.
IFVG – Inverted Fair Value Gap. After returning to such an area, price doesn't react; it impulsively breaks it and then tests it from the other side.
OB – Order block. The candle where a market-maker opened a position aiming to take liquidity to form their own position in the opposite direction.


