


















GBP/USD
Brief Analysis:
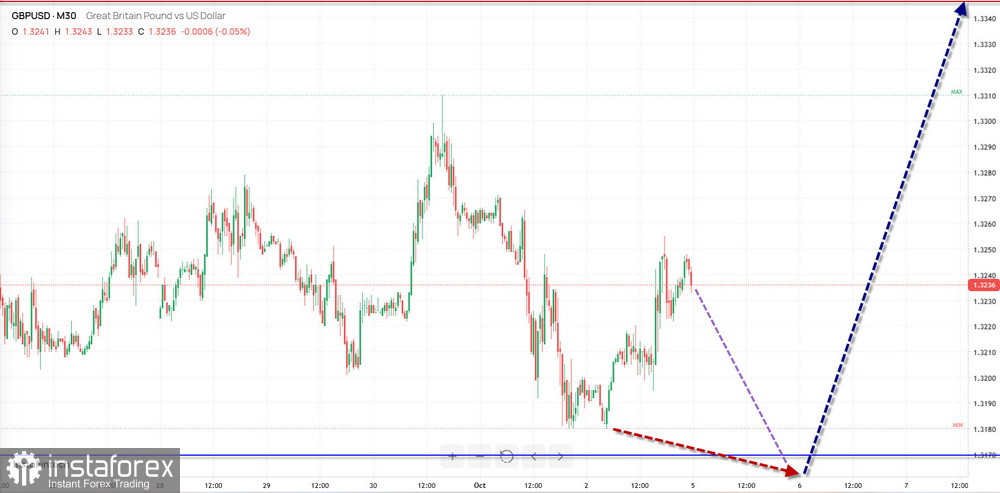
On the chart of the GBP/USD major pair, the dominant trend throughout the current year has been moving the pair's price predominantly sideways. The final part (B) has been forming within the wave over the past three months. The lines drawn through the price extremes on the chart form a "flag" along the upper boundary of a strong potential reversal zone.
Forecast for the Week:
At the beginning of the coming week, the price of the British currency is likely to retrace toward the calculated support zone. A reversal may then begin to form. By the end of the week, the upward price movement is expected to resume. The resistance zone represents the expected upper limit of the pair's weekly range.
Potential Reversal Zones
Resistance:
- 1.3370/1.3420
Support:
- 1.3170/1.3120
Recommendations
Buying: May be considered during individual sessions with a reduced position size. The upward potential is limited by resistance.
Selling: May become relevant after appropriate signals from your trading systems appear near the resistance zone.
AUD/USD
Brief Analysis:
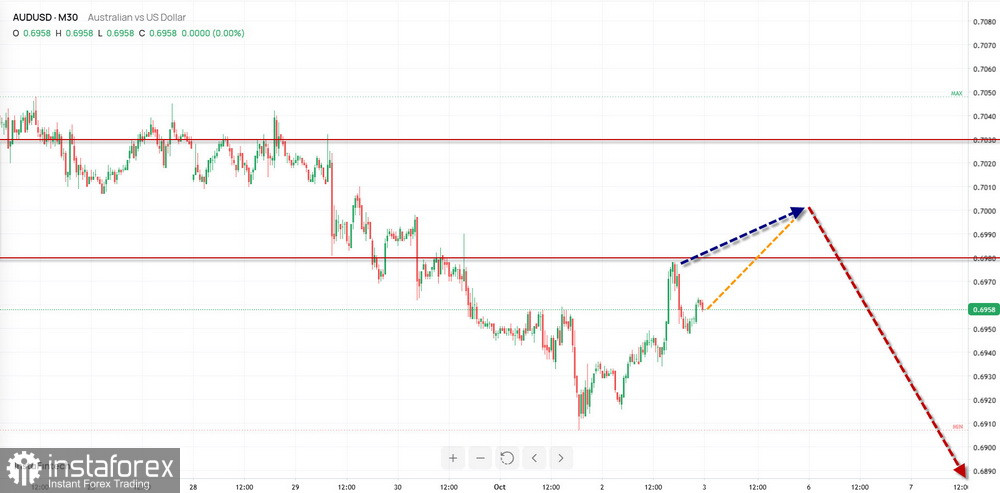
In the AUD/USD major pair, a counter-trend correction has been developing throughout the current year within the dominant upward trend. The unfinished segment dates back to the beginning of September. The structure of this wave segment does not indicate completion at the time of analysis. The price is approaching the upper boundary of a strong potential reversal zone.
Forecast for the Week:
Over the coming week, the "Aussie" is expected to continue moving within the range between the nearest zones of opposing directions. After a likely retracement toward the resistance zone at the beginning of the week, a reversal and continued decline in the pair are expected toward the calculated zone. When the direction changes, a brief break above the upper boundary of the zone cannot be ruled out.
Potential Reversal Zones
Resistance:
- 0.6980/0.7030
Support:
- 0.6840/0.6790
Recommendations
Selling: May become possible after confirmed signals appear near the calculated zone.
Buying: Has limited potential and is risky for the trading account.
USD/CHF
Brief Analysis:
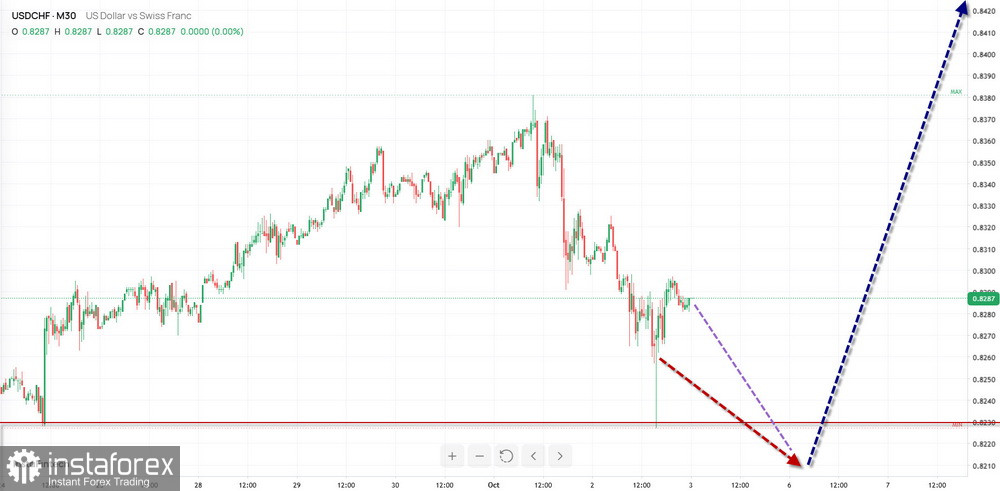
On the chart of the USD/CHF major pair, the upward wave that started at the beginning of the year continues to dominate. Its structure is developing as a classic zigzag. The final part (C) has been developing within the wave since August 20. Last week, the price broke through a cluster of resistance levels of different timeframes, turning them into support.
Forecast for the Week:
Over the coming days, the pair is expected to move predominantly sideways. A retracement toward the support level is possible. A reversal and renewed price growth are then highly likely. A move beyond the projected support/resistance boundaries is unlikely.
Potential Reversal Zones
Resistance:
- 0.8470/0.8520
Support:
- 0.8210/0.8160
Recommendations
Selling: Due to the limited potential, there is a high risk of losses to the trading account.
Buying: May be considered with a reduced position size after appropriate signals from your trading systems appear near support.
EUR/JPY
Brief Analysis:
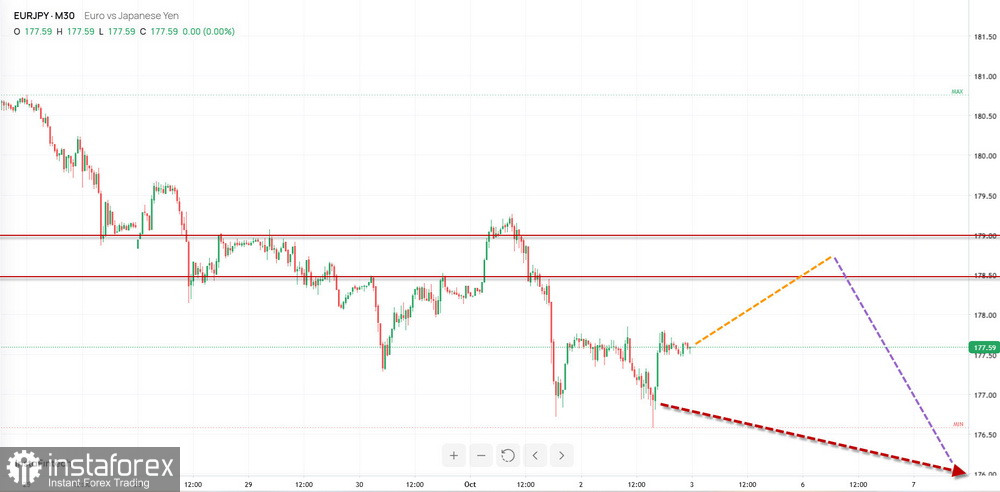
The current short-term upward wave structure on the EUR/JPY chart began at the beginning of August. It is formed as a running/expanded flat with a very extended middle part (B). The wave remains incomplete at the time of analysis. The price is approaching the upper boundary of a potential reversal zone on the weekly timeframe.
Forecast for the Week:
At the beginning of the coming week, the pair is expected to move sideways with an upward bias. The rise is unlikely to extend beyond the resistance zone. By the end of the week, a reversal and renewed price decline are likely.
Potential Reversal Zones
Resistance:
- 178.50/179.00
Support:
- 175.70/175.20
Recommendations
Buying: May be considered intraday with a reduced position size. The potential of such trades is limited by resistance.
Selling: May be considered after confirmed reversal signals appear near the resistance zone.
EUR/GBP
Analysis:
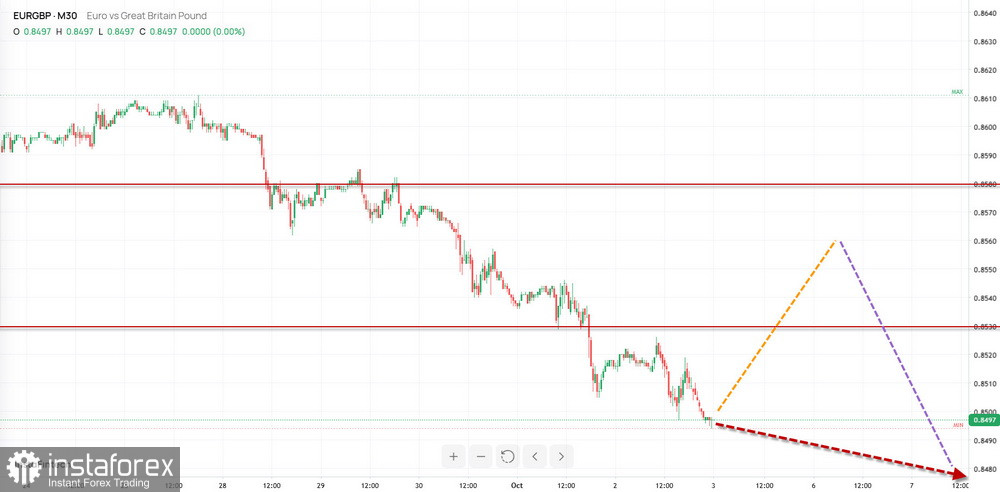
An analysis of the weekly chart of the EUR/GBP pair shows the formation of a downward wave since November last year. Over the past two months, the price has been moving sideways. At the end of September, a new period of activity pushed the price below a cluster of support zones at different levels.
Forecast:
Sideways movement is also likely over the coming days. The price may rise toward the upper zone, and brief pressure on the resistance zone cannot be ruled out. A reversal and renewed downward movement may then develop from this zone, extending toward the boundaries of the calculated support.
Potential Reversal Zones
Resistance:
- 0.8530/0.8580
Support:
- 0.8390/0.8340
Recommendations:
Buying: Has limited potential. For greater safety, it is advisable to reduce the position size.
Selling: After appropriate signals from your trading systems appear near resistance, selling may become the primary trading direction.
Bitcoin
Brief Analysis:
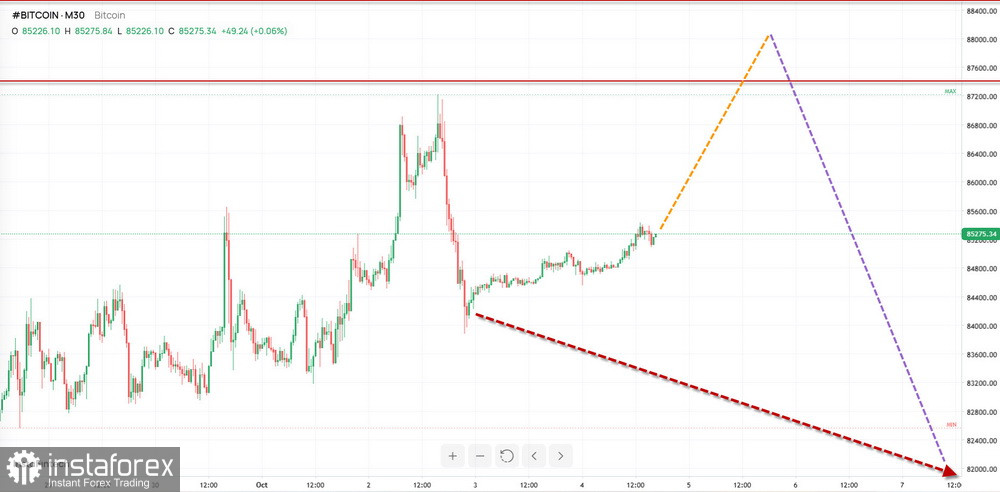
The short-term bullish wave that started at the beginning of May is approaching completion. The price is within a cluster of resistance/support levels of different timeframes. The wave level of the counter-trend structure that started on August 21 is gradually rising closer to the reversal level.
Forecast for the Week:
During the first half of the coming week, predominantly sideways movement is most likely. An upward bias is more likely, with the price rising no higher than the resistance level. A renewed decline in the coin's price may then begin.
Potential Reversal Zones
Resistance:
- 87500/88500
Support:
- 80800/79500
Recommendations
Buying: Has limited potential and is risky.
Selling: May be considered after reversal signals from your trading systems appear near the resistance zone.
Ethereum
Analysis:
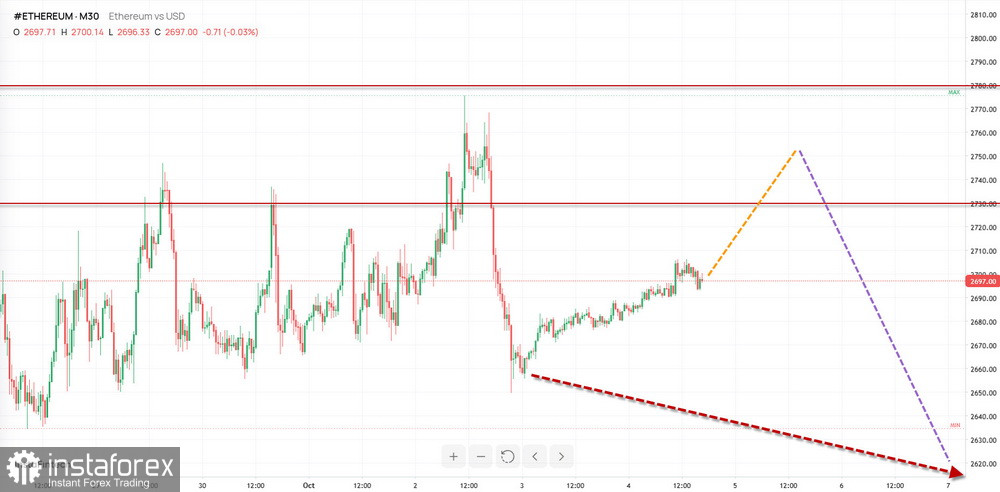
On the Ethereum market, a downward wave has been developing since the end of August this year in the form of a running/expanded flat. Its potential exceeds the retracement level of the previous trend segment. The unfinished downward wave segment dates back to September 21. The price is within a narrow price corridor between two opposing zones.
Forecast:
At the beginning of the coming week, an upward movement is expected. Near the calculated resistance, the price may stall and conditions for a reversal may begin to form. By the end of the week, volatility is likely to increase, with the price of Ether moving lower.
Potential Reversal Zones
Resistance:
- 4730.0/4830.0
Support:
- 4270.0/4170.0
Recommendations:
Buying: Is fairly risky and may result in losses to the trading account.
Selling: May be considered with a reduced position size after signals from your trading systems appear near the resistance zone.
Notes: In simplified wave analysis (SWA), all waves consist of three parts (A-B-C). On each timeframe, the latest unfinished wave is analyzed. Expected movements are shown with dashed lines.
Attention: The wave algorithm does not take into account the duration of instrument movements over time.


