


















Bitcoin and Ether remain in a pause before... a new leg up? Or a correction? Recall that the two most important recent developments for the crypto world were more negative than positive. Central banks (notably the Fed) began to tighten monetary policy, which lifts demand for safe assets such as bank deposits and sovereign bonds. And although demand for Treasuries has fallen globally, yields have risen, which means investors might restore demand for those securities in the future if the US government and others take action. So far the White House has limited itself to buybacks of bonds, which in theory should have stopped yields from rising. However, since the US Treasury adopted that decision, 30-year yields have risen about 6% and 10-year yields about 12%...
Meanwhile, most world experts continue to predict a new powerful rally in the primary cryptocurrency. For example, research firm VanEck said Bitcoin will continue to rise and could reach $3m per coin by 2050. Of course, several conditions accompany that projection. According to the firm's analysts, Bitcoin must see broad adoption in international trade and in energy markets. Put simply, Bitcoin must start to be used not only by individuals and investors but also by large corporations and banks. Not only as an investment to profit from price appreciation, but also as a regular means of payment. In other words, Bitcoin must become a fully-fledged part of the financial system and displace fiat and bank transfers, and then its price could rise to several million dollars.
Of course, nobody knows the future, and it is probably wrong to say impossible things do not happen. However, in nearly 20 years Bitcoin has not become a replacement for fiat or bank transfers. The overwhelming majority of users employ it as a tool to capture price differences. With current volatility, Bitcoin is unlikely to gain status as an international means of payment.
Trading recommendations for BTC/USD
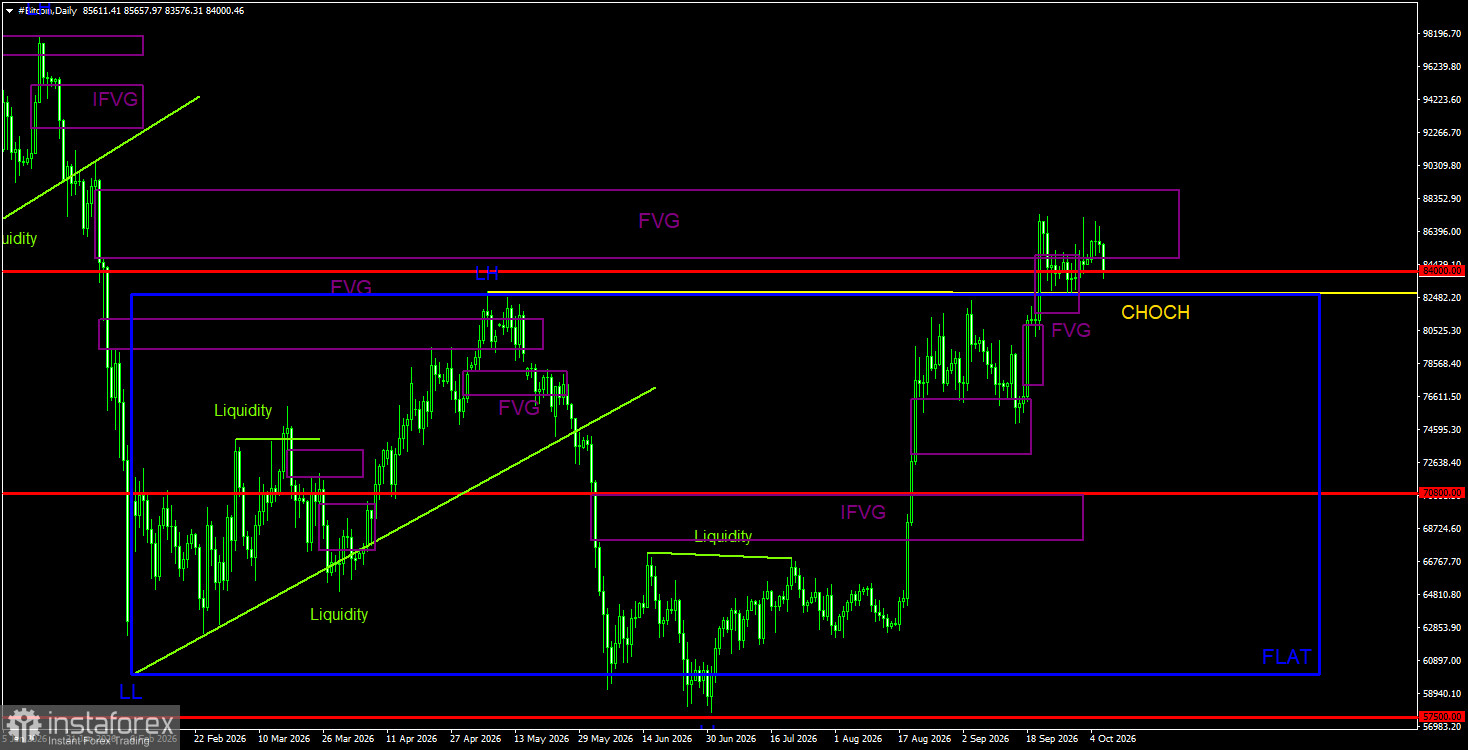
Bitcoin shows all the signs of the start of a new bull trend. This trend begins, as it often does, with a pump that lacks clear, specific reasons. The Fed has not started cutting rates, and the Clarity Act was not passed. In the near term on the daily timeframe, Bitcoin may be in a decline because sellers are currently aided by a bearish FVG. Also note that the current breakout beyond the daily sideways channel could be a deviation. Yes, a deep deviation, but still a deviation. If so, Bitcoin could head for $70,800. We believe short positions are more relevant in the near term.
Trading recommendations for ETH/USD
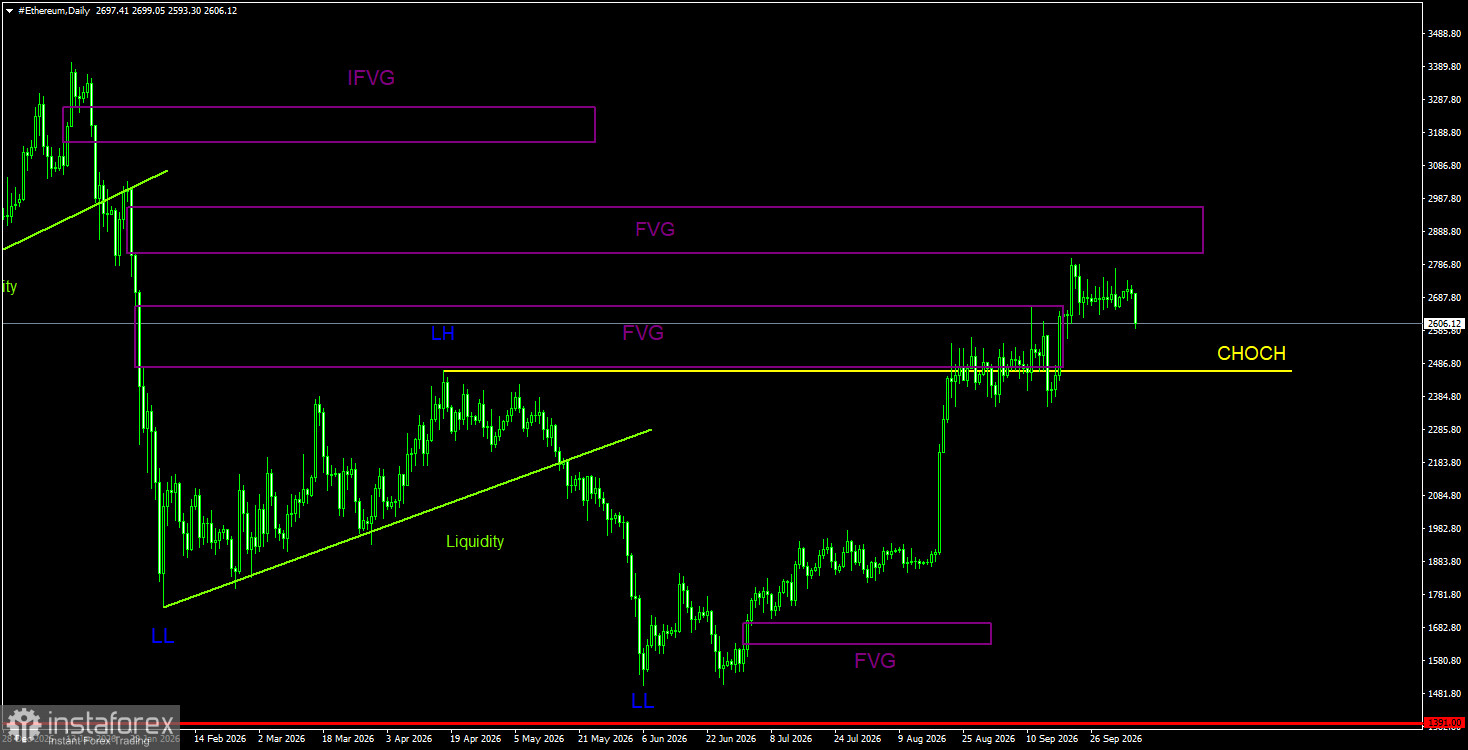
On the daily timeframe, the technical picture for Ether changed completely in just a few days. Now Ether is oriented toward a new uptrend. However, traders should rely on the weekly chart, where Ether has targeted $4,800, the upper boundary of a five-year sideways channel. On the daily timeframe the first bearish FVG did not prompt a noticeable price reaction, but the next FVG, together with a similar pattern on Bitcoin, could trigger a significant decline in ether. On the 4-hour chart there was a reaction to a local bearish FVG, after which a powerful drop began—a move that could have been traded with shorts on a clear signal. We continue to expect declines in both ether and bitcoin.
Explanations of the illustrations
CHOCH—change of character, break of trend structure.
Liquidity—liquidity, stop losses, and pending orders that market makers use to build positions.
FVG—fair value gap, an area of price inefficiency. Prices move quickly through such areas, indicating the absence of one side in the market. Later prices tend to return and react to these areas in the direction of the main trend.
IFVG—inverted fair value gap. After a return to such an area, price receives no reaction and impulsively breaks through, then tests from the other side.
OB—order block. The candle where a market maker opened a position to capture liquidity and set up a position in the opposite direction.


