


















Review of Friday's trades:
1H chart of the EUR/USD pair
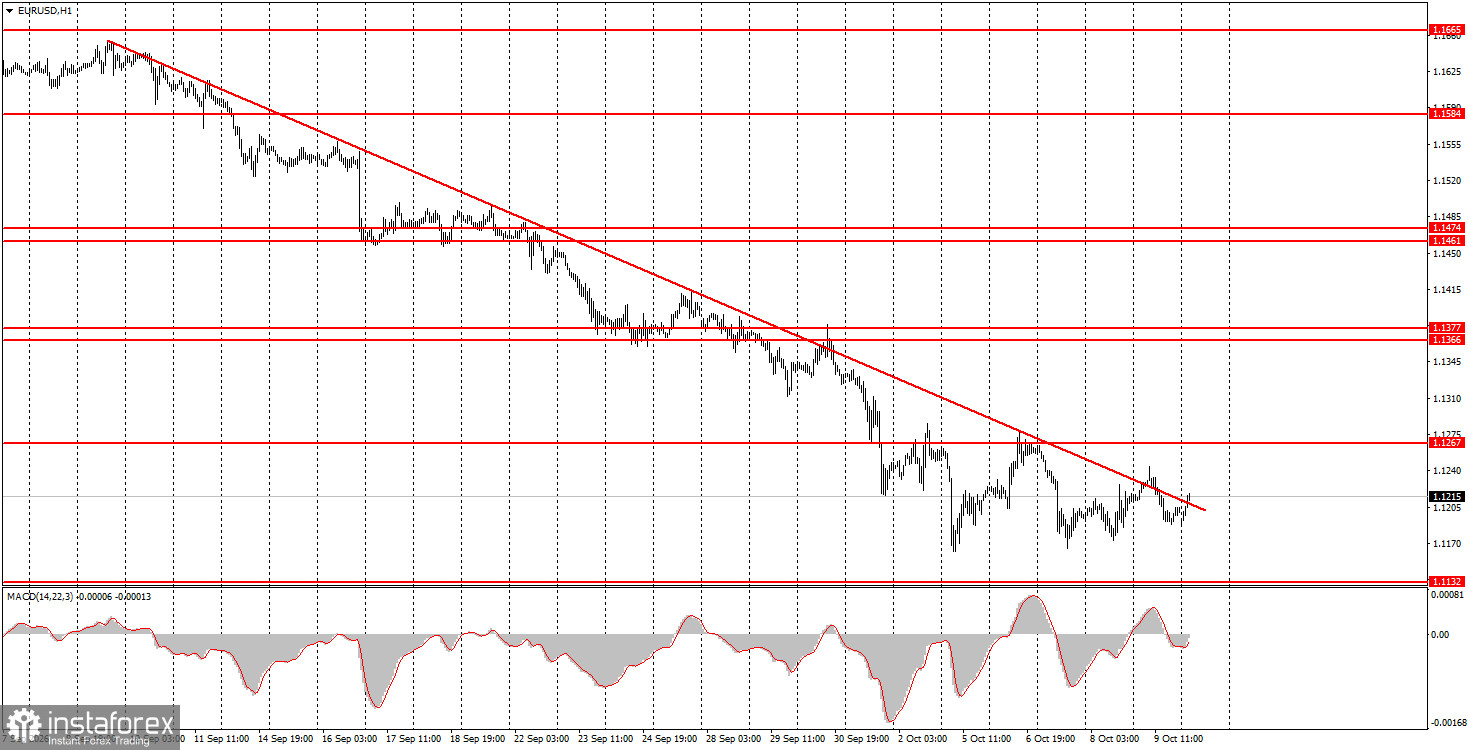
The EUR/USD currency pair generally maintained a downward bias on Friday and showed neither a rise nor a fall. After a monthly decline, the pair stalled and traded mostly sideways for nearly a full week. Thus, even after a 500-pip drop, the euro has not shown a meaningful correction. The descending trendline was breached, but given the force of that trend, there are plenty of reasons to doubt that it will end out of the blue. A correction has been brewing for several weeks, and even two weeks ago there were no reasons for further US dollar strength. The speculative, inertia-driven movement continues. On Friday, among the more or less interesting events, the University of Michigan consumer sentiment index came in worse than forecasts, yet the dollar rose for most of the day. Macroeconomic data continue to have a very indirect influence on the pair's movement, and the market either interprets most news in favor of the dollar or ignores it.
5M chart of the EUR/USD pair
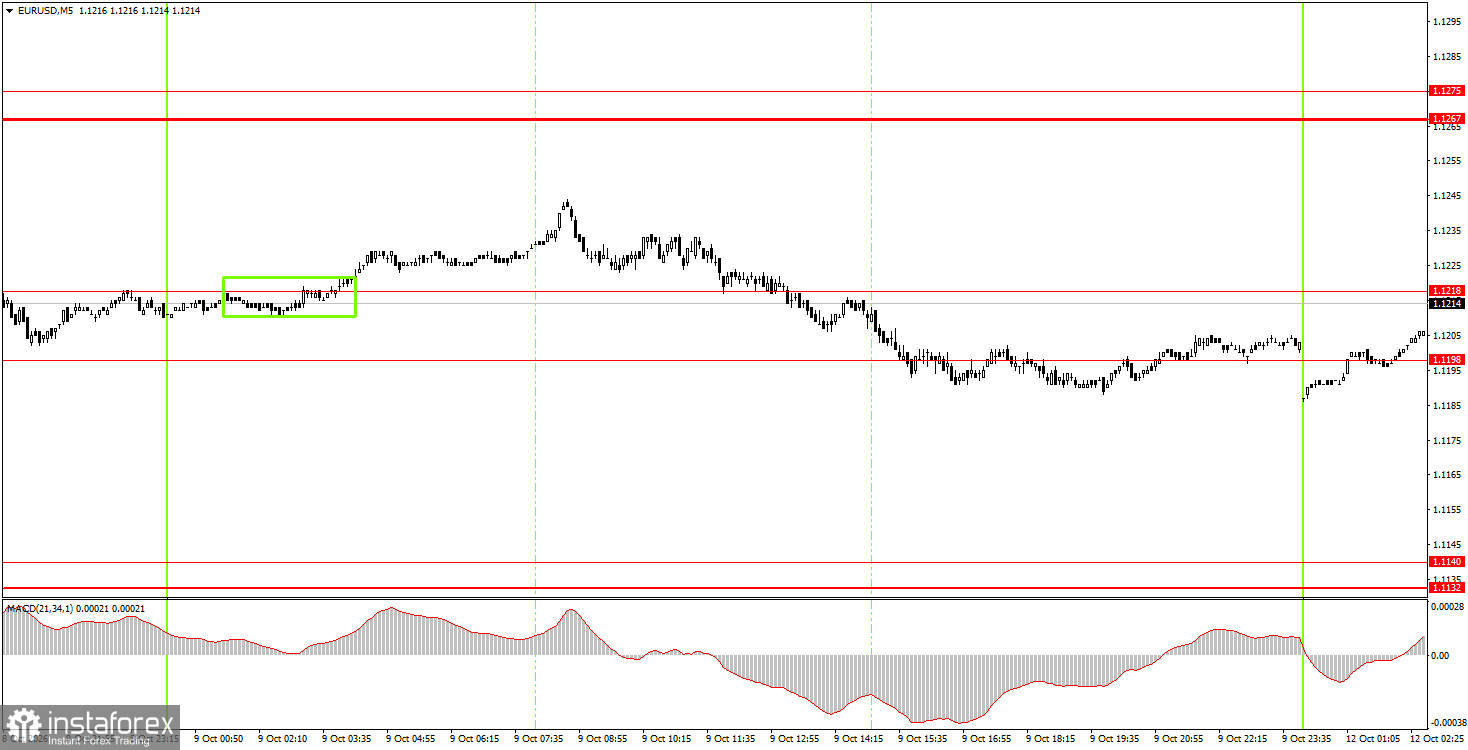
On the 5-minute timeframe, a buy trading signal was formed on Friday. Earlier, during the Asian session, price rebounded from the 1.1198–1.1218 area, triggering a 16-pip rise. Thus, novice traders could open long positions on that signal, but it was extremely difficult to realize profit on those trades.
How to trade on Monday:
On the hourly timeframe, the EUR/USD pair continues a downward trend that qualifies as a full trend. Given the events of recent months, we do not believe the euro should be collapsing like a stone. But the market keeps buying the US dollar, ignoring any events or releases.
On Monday, novice traders may consider new short positions if price closes below the 1.1198–1.1218 area, targeting 1.1132–1.1140. Open long positions if price closes above the 1.1198–1.1218 area, targeting 1.1267–1.1275.
On the 5-minute timeframe consider the levels 1.1088, 1.1132–1.1140, 1.1198–1.1218, 1.1267–1.1275, 1.1366–1.1377, 1.1461–1.1474, 1.1527–1.1531, 1.1584–1.1594, 1.1655–1.1665. On Monday,, no major events or releases are scheduled in the Eurozone or the US. Therefore, the market has nothing to react to today. Market movements have calmed over the past week, so we're likely to see low volatility and a sideways direction today.
Key Rules of the Trading System:
- The strength of a signal is determined by the time it takes to form the signal (rebound or breakout). The less time taken, the stronger the signal.
- If two or more trades were opened at a certain level based on false signals, all subsequent signals from that level should be ignored.
- In a range (flat), any pair can generate many false signals or may not produce any at all. Technical levels may be disregarded.
- On the hourly timeframe, trading signals from the MACD indicator should be acted upon only when volatility is high, and a trend line or trend channel confirms the trend.
- If two levels are too close together (within 5-20 pips), treat them as a support or resistance area.
- After moving 15 pips in the right direction, a stop-loss should be set to break even.
What to Look for on the Charts:
Price levels (areas) of support and resistance serve as targets for opening buy or sell trades or as sources of signals.
Red lines indicate channels or trend lines that show the current trend and the preferred trading direction.
The MACD indicator (14,22,3) — the histogram and signal line — is an auxiliary indicator that can also provide signals.
Important speeches and reports (listed in the news calendar) can significantly influence currency pair movements. Therefore, during their release, traders should approach trading with utmost caution, or exit the market to avoid sudden reversals against the preceding move.
Beginner forex traders should remember that not every trade can be profitable. Developing a clear strategy and practicing money management are key to long-term success in trading.


