


Trade review for Friday:
1H chart of the GBP/USD pair
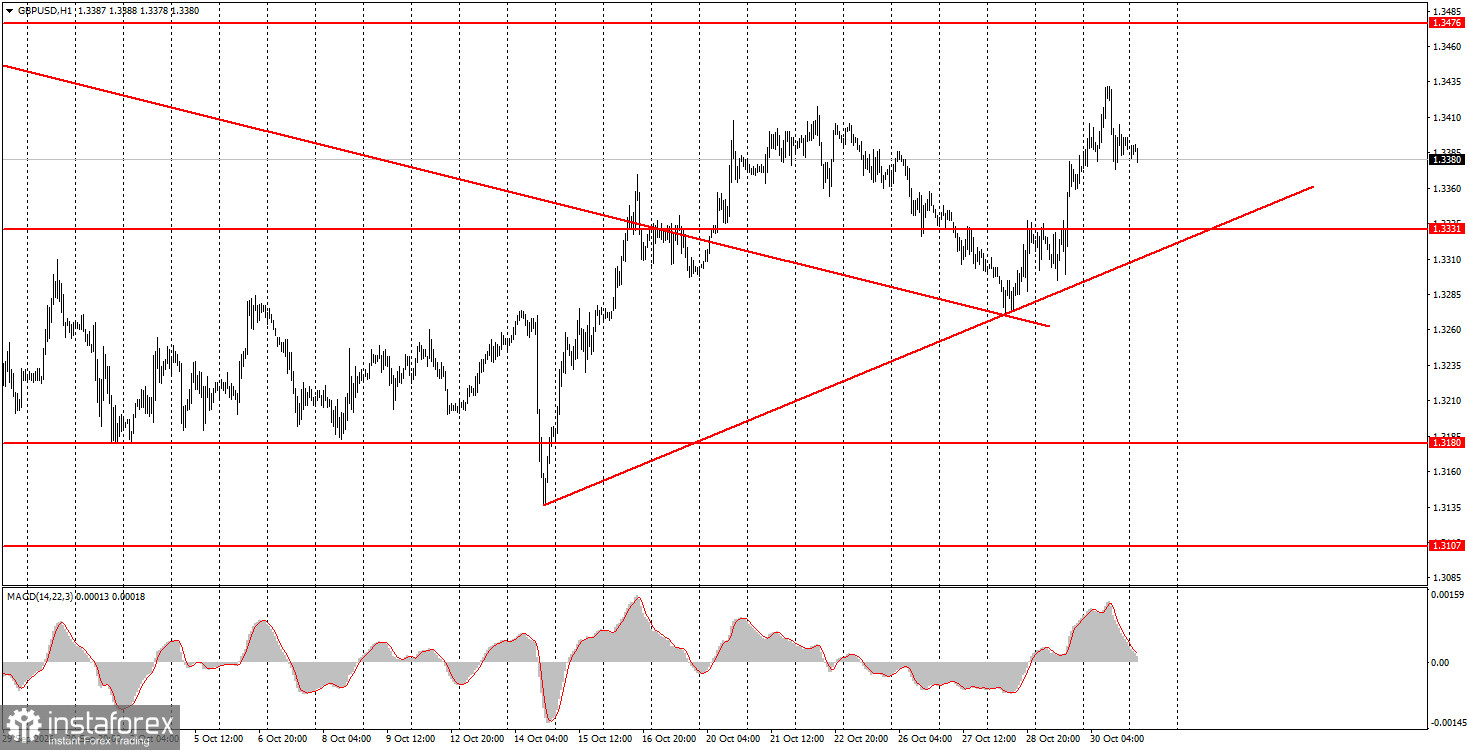
GBP/USD posted a modest drop on Friday, but before that it continued higher within the uptrend that has formed in recent weeks. As we have noted before, sterling is moving far more logically and technically than the euro right now. The pound does not ignore its positive fundamentals and "respects" the technical picture on higher timeframes. That technical setup allowed an uptrend to start on the hourly chart from about 1.3150. We believe sterling's advance can continue under most circumstances. On the daily and weekly timeframes, the pair remains inside sideways channels, so it's reasonable to expect a move toward the upper boundaries after the lows have been worked off — the nearest upper boundary lies around 1.3650. Also note that the Bank of England is likely to raise its policy rate this week, which should support sterling. Remember too that U.S. congressional elections take place tomorrow and key U.S. labor reports are due on Friday — markets may be volatile this week.
5M chart of the GBP/USD pair
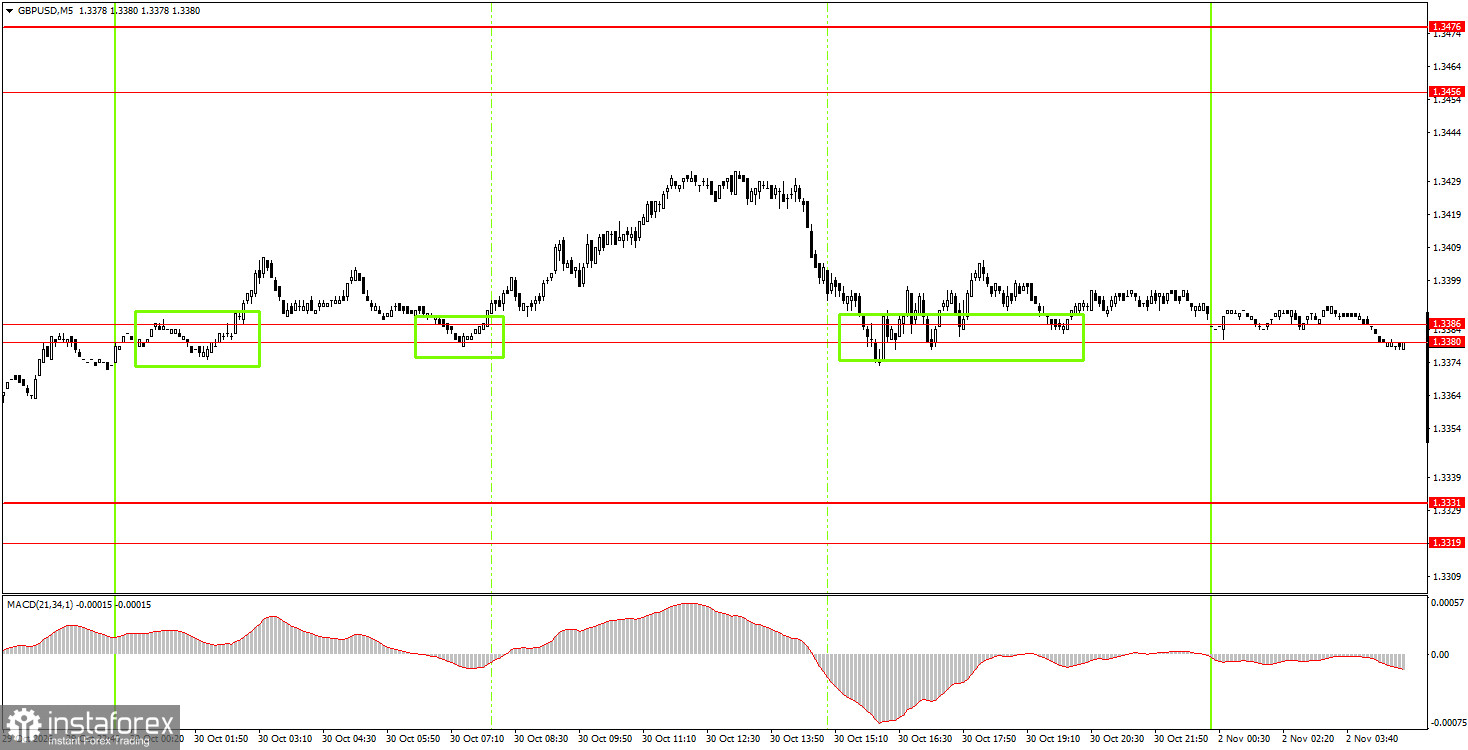
On the 5-minute timeframe, three buy signals formed on Friday. Price bounced three times from the 1.3380–1.3386 area, each time offering novice traders an opportunity to open long positions. The first two signals duplicated each other; the third arrived too late in the session and could be ignored. In practice, traders could have taken only one long and would have needed to close it for profit manually.
How to trade on Monday:
On the hourly timeframe, GBP/USD continues forming an uptrend. Sterling has shown and continues to show greater resilience versus the dollar (than the euro), so it has good chances to extend the uptrend. The technical picture across timeframes supports sterling's rise. The fundamental backdrop and the dollar's stretched condition also support GBP/USD.
On Monday, novice traders can consider short positions targeting 1.3319–1.3331 if price holds below the 1.3380–1.3386 area. Open long positions targeting 1.3456–1.3476 if price bounces again from the 1.3380–1.3386 area.
On the 5-minute TF consider trading the levels 1.3043, 1.3096–1.3107, 1.3175–1.3180, 1.3259–1.3267, 1.3319–1.3331, 1.3380–1.3386, 1.3456–1.3476, 1.3587–1.3598, 1.3631–1.3641. No major U.K. releases are scheduled for Monday; in the U.S., the ISM manufacturing index will be published and could provoke a noticeable market reaction.
Main rules of the trading system:
- Signal strength is judged by how long the signal took to form (a bounce or a breakout). The less time required, the stronger the signal.
- If two or more false signals have been generated around a given level, all subsequent signals from that level should be ignored.
- In a flat (range), any pair can produce many false signals or none at all. Technical levels can be ignored.
- On the hourly timeframe, ideally trade MACD signals only when volatility is strong, and a trendline or trend channel confirms the trend.
- If two levels are placed very close to each other (5–20 pips), treat them as a support/resistance area.
- After a price moves 15 pips in the intended direction, move the Stop Loss to breakeven.
What is shown on the charts:
Price levels (areas) of support and resistance — levels that serve as targets when opening longs or shorts or as sources of signals.
Red lines — channels or trendlines that display the current trend and indicate the preferred trading direction.
MACD indicator (14,22,3) — histogram and signal line — an auxiliary indicator that can also be used as a source of signals.
Important speeches and reports (listed in the news calendar) can strongly affect a currency pair's movement. Therefore, when they are released, one should trade as cautiously as possible or step aside to avoid a sudden price reversal against the prior direction.
Beginner forex traders should remember that not every trade can be profitable. Developing a clear strategy and money-management rules is the key to long-term success in trading.


