


Analysis GBP/USD 5M
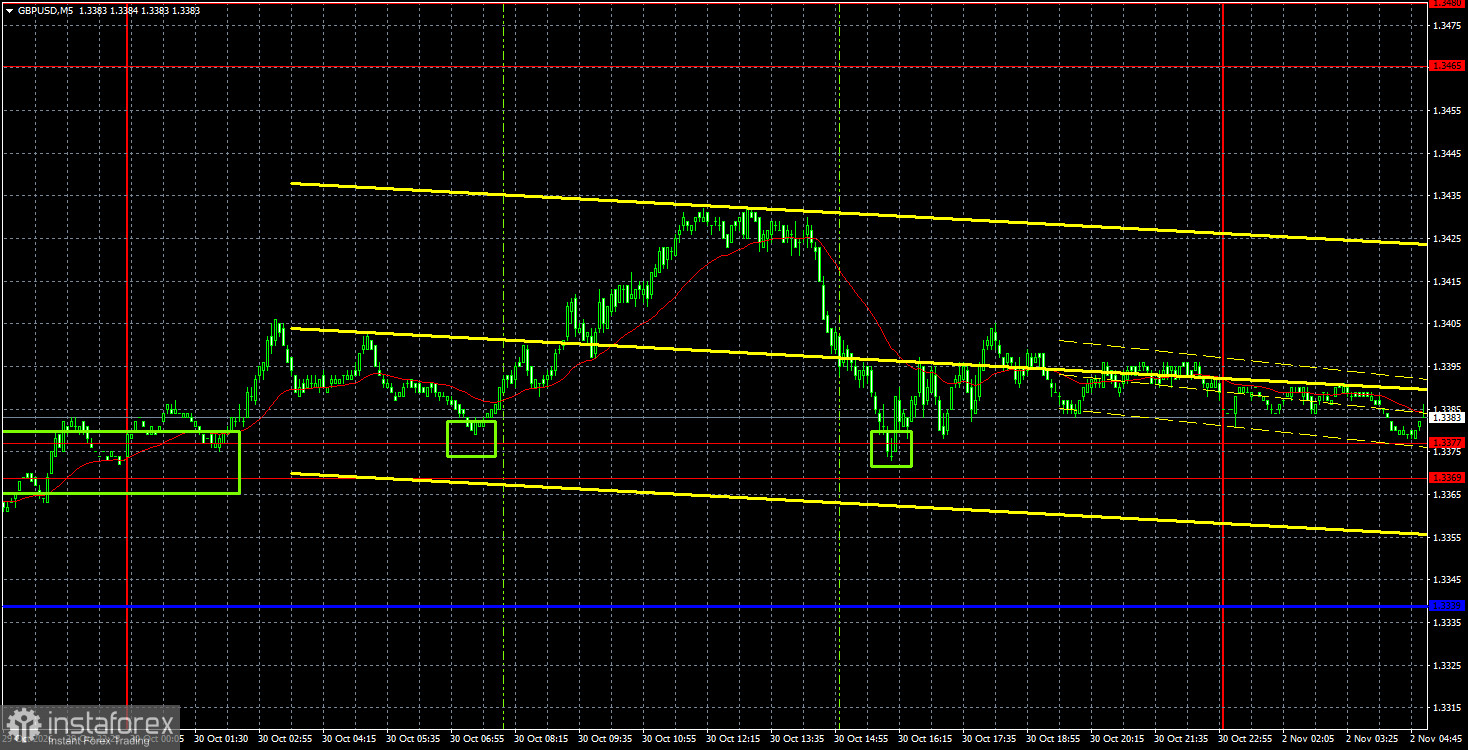
The GBP/USD pair eased slightly on Friday but continues to deliver technical, logical moves that please traders. The hourly timeframe still shows an emerging uptrend, and there are currently no signs it is ending. Price pulled back to the 1.3369–1.3377 area, and a rebound from that zone could trigger a new leg higher. Over the medium term, we fully support sterling's upside on both technical and fundamental grounds. The pound remains inside two sideways channels on the daily and weekly timeframes, and after bouncing from their lower boundaries, we still expect a move toward the upper edges. The minimum target is 1.3650. We also believe the market has not yet priced in any of the Bank of England's tightening, which appears poised to begin this week. The dollar has not managed a convincing long-term rally in 2026 despite support from two strong factors — geopolitics and the Federal Reserve — so in the long run we continue to expect sterling to rise. No important U.K. or U.S. reports were released on Friday.
Technically, sterling continues to form a new uptrend. The pound did not close below the Senkou Span B line, so the bullish bias remains intact. The 1.3369–1.3377 area also acts as support for the currency. We believe the pound has every chance and every reason to continue moving north.
On the 5-minute timeframe, two solid buy signals formed on Friday. Price bounced twice from the 1.3369–1.3377 area, offering traders opportunities to open long positions. Traders did not reach the nearest target area of 1.3465–1.3480, but new buy signals and further upside may emerge this week.
COT report
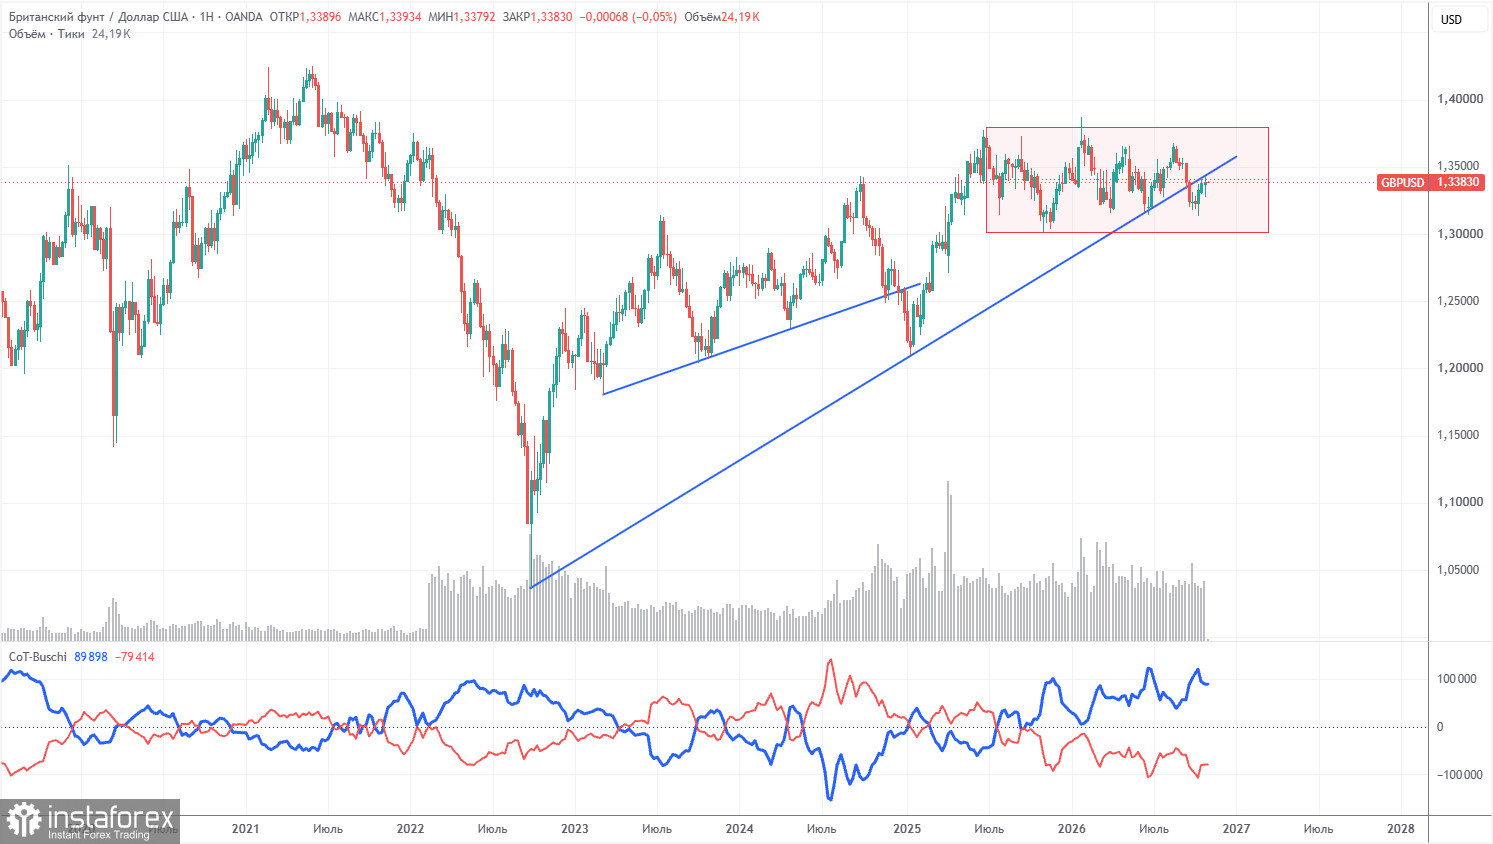
COT reports for the pound show non-commercial traders have been net sellers for several months. The net position is negative despite the persistent long-term uptrend. Given events in the Middle East, it is unsurprising that dollar demand has been relatively strong in 2026. The U.S.–Iran war is formally paused but could resume soon. The Fed's changed monetary stance also supports the dollar, and the dollar's ascending trend line was breached—though amid a flat—so we do not regard the uptrend as finished.
Over the long term, the dollar continues to weaken under U.S. policy trends, as visible on the weekly timeframe. Trade tensions will continue in one form or another, and policy is generally directed toward dollar weakening. According to the latest COT report (dated October 27), the "Non-commercial" group opened 2,400 BUY contracts and closed 1,400 SELL contracts. Thus, the net position of non-commercial traders rose by 1,000 contracts over the week.
Analysis GBP/USD 1H
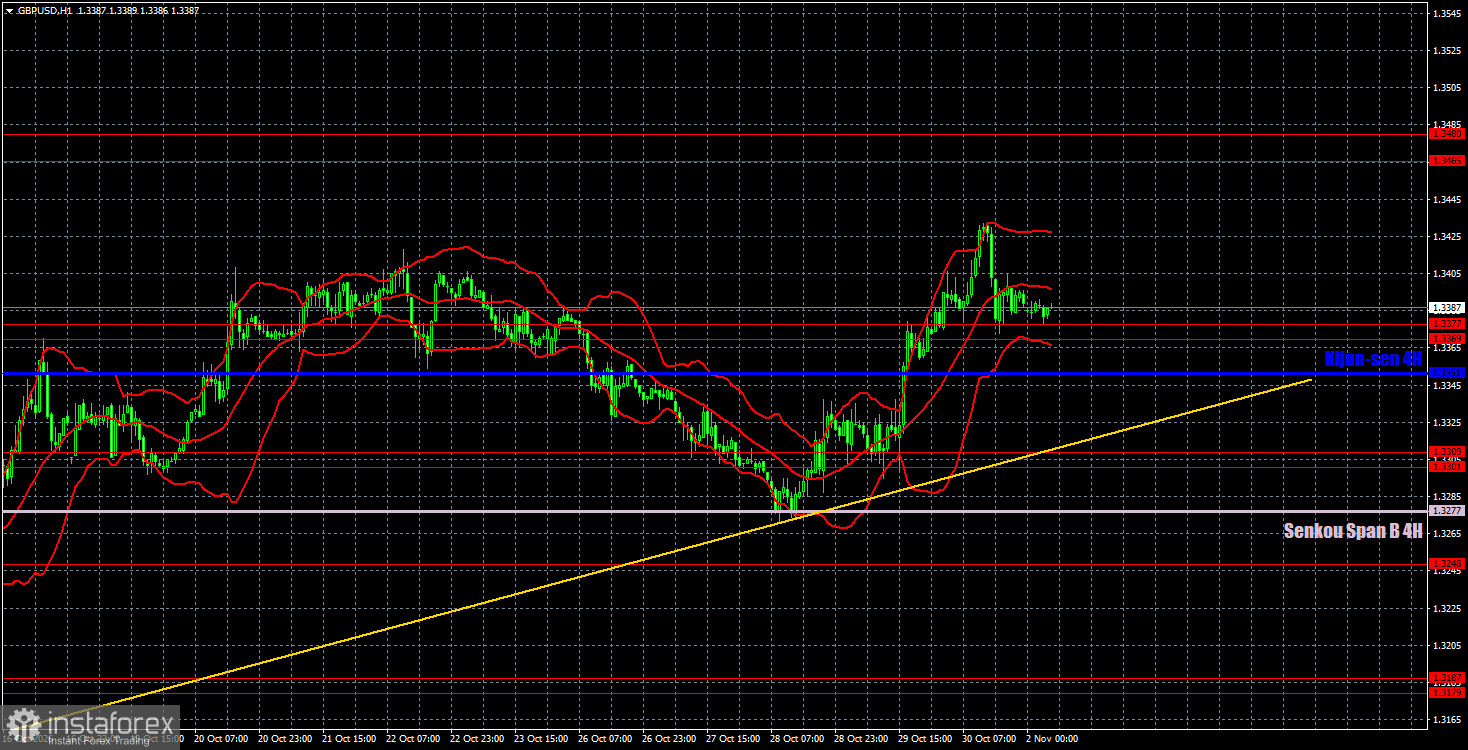
On the hourly timeframe, GBP/USD continues to form a logical, orderly uptrend. On the daily and weekly timeframes, price cleared liquidity from recent lows and remained inside sideways channels. Therefore, one can expect the pound to rise at least to the 1.3650 level, which is the upper boundary of the daily sideways channel. Reasons for the pound's rise are not required, just as reasons were not required for the dollar's rise over the past one and a half to two months.
For November 2 we highlight the following important levels: 1.3042–1.3050, 1.3096–1.3115, 1.3179–1.3187, 1.3248, 1.3301–1.3309, 1.3369–1.3377, 1.3465–1.3480, 1.3588, 1.3671–1.3681. The Senkou Span B line (1.3277) and the Kijun-sen (1.3351) can also provide signals. It is recommended to move the Stop Loss to breakeven after the price moves 20 pips in the right direction. Ichimoku lines may shift during the day, which you should take into account when determining trading signals.
No major events or releases are scheduled in the U.K. today; in the U.S., the ISM manufacturing index will be released and may prompt a reaction from traders. The U.S. midterm elections are tomorrow, and that event could also leave its mark on currency markets.
Summary of the above analysis:
Traders can consider the 1.3301–1.3309 area as a target for short positions if price holds below the 1.3369–1.3377 area. A rebound from the 1.3369–1.3377 area makes 1.3465–1.3480 a target for long positions.
Notes on the charts:
- Support/resistance price levels (thick red lines) are areas where a move may stop; they are not direct signal sources.
- Kijun-sen and Senkou Span B — Ichimoku lines projected from the 4-hour timeframe onto the hourly chart — are strong levels.
- Extremum levels (thin red lines) are prior bounce points and do serve as signal sources.
- Yellow lines denote trendlines, trend channels, and other technical patterns.
- Indicator 1 on the charts (COT) shows the net position size for each trader category.


