


Bitcoin continues to decline, and this movement could develop into another full-fledged phase of the downward trend that began last year. Over the past few weeks, Bitcoin has lost approximately $11,000 in value. At present, the movement is considered corrective. However, Bitcoin is showing increasing downward pressure despite regular pullbacks. It should be noted that the possibility of the downward trend having ended cannot be ruled out. However, the reasons for a new upward trend remain ambiguous and debatable. Bitcoin's latest rally, which lasted three months, essentially represented a movement from the lower boundary of the sideways channel to its upper boundary on the daily timeframe, following the formation of a deviation below the channel's lower boundary and then a deviation above its upper boundary. The deviation above the upper boundary was substantial, but if it was indeed a deviation, Bitcoin is now heading toward the $70,800 level. The digital asset has firmly returned to the sideways channel, making a move toward its 50% level entirely logical and consistent with the current market structure.
During yesterday's trading session, Bitcoin unexpectedly rose. However, there is no reason to rush to conclusions or assume that the downward movement has ended. On the daily timeframe, the price reached the nearest bearish FVG, from which a reaction is highly likely. If such a reaction occurs, Bitcoin will resume its decline toward the previously mentioned targets. It is important to note that the fundamental backdrop for Bitcoin and the broader cryptocurrency market has not changed in recent days. The Democrats' election victory is potentially negative primarily because they are not particularly supportive of digital assets. Donald Trump wanted to turn the United States into a global cryptocurrency hub. However, the Clarity Act failed to pass through Congress even when Republicans controlled it. Now, Congress is controlled by Democrats, making the chances of the Clarity Act being passed even lower. Furthermore, Bitcoin has historically experienced significant declines following midterm elections. This decline has not even begun yet. Although this is a historical pattern, there are still no fundamental reasons to expect a sustained upward trend.
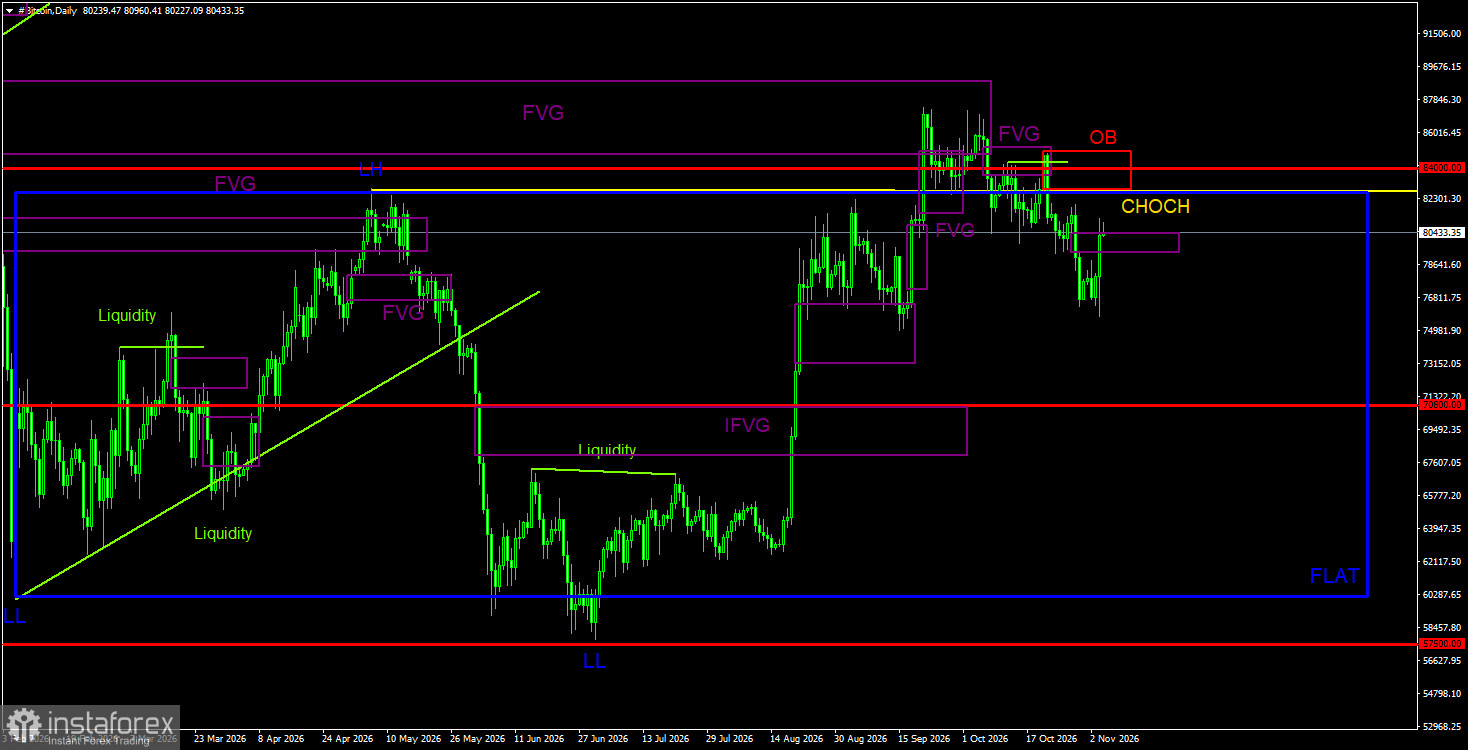
Overall BTC/USD Outlook on the 1-Day Timeframe
On the daily timeframe, the bearish trend structure has been broken. Therefore, the digital asset has most likely officially entered a new upward trend. The price reached a bearish FVG from the previous trend and reacted to this pattern, triggering the expected correction. However, the move beyond the 60,000–82,500 sideways channels in September may have been a deviation. Combined with the reaction to the bearish FVG, this could trigger a decline toward the lower boundary of the sideways channel. Bitcoin has corrected toward the nearest bearish FVG and may therefore resume its decline from this pattern as early as this week.
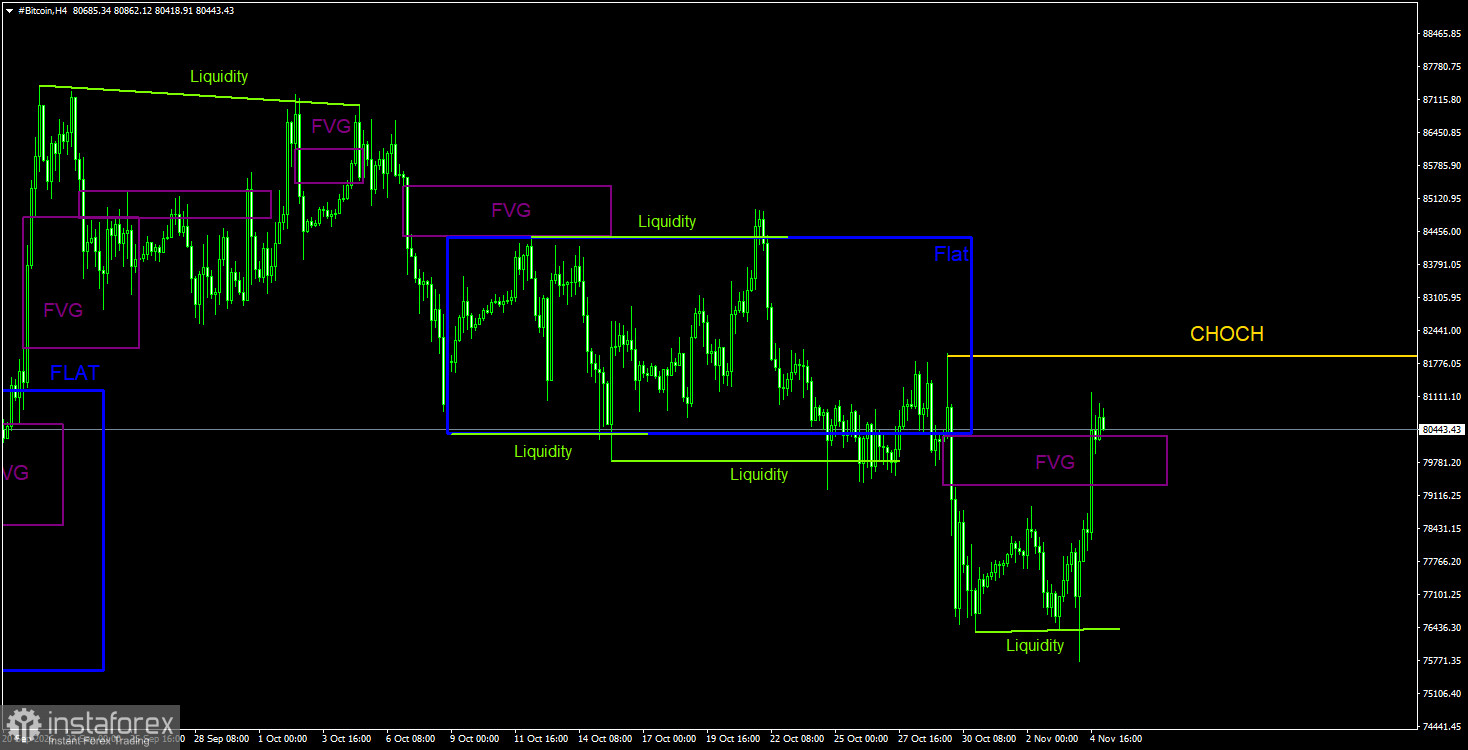
Overall BTC/USD Outlook on the 4-Hour Timeframe
The bearish trend structure continues to develop on the 4-hour timeframe. The CHOCH level is currently at $82,000. All the necessary reversal signals were received on the daily timeframe, allowing traders to open short positions. At present, Bitcoin's targets are best determined by reference to the sideways channel on the daily chart, which remains relevant in our assessment. The trend structure is bearish on the 4-hour timeframe, while Bitcoin may react to the bearish pattern on the daily timeframe. Therefore, until the bearish FVG on the daily timeframe is invalidated, further downside movement remains the primary scenario.
BTC/USD Trading Recommendations:
Bitcoin attempted to establish a new upward trend, but the fundamental backdrop, spot demand, and recent news remain too weak to support its continuation. In the near term, Bitcoin may continue to decline on the daily timeframe, as the price has reacted to two bearish FVGs and formed a bearish Order Block. The move beyond the sideways channel on the daily chart is currently interpreted as a deviation. Thus, Bitcoin has generated a reversal signal and is heading toward the $70,800 level. Since a sideways market does not guarantee that the prevailing trend has ended, the bearish trend is not considered complete. Short positions remain the most relevant trading option in the near term. Among the current trading patterns, the bearish FVG on the daily chart is worth noting.
Explanations for the Illustrations:
CHOCH – Change of Character; a break in the trend structure.
Liquidity – Stop Loss orders and pending orders that market makers use to accumulate positions.
FVG – Fair Value Gap; an area of price inefficiency. Price moves through such areas very quickly, indicating a significant imbalance between buyers and sellers. Subsequently, price tends to return to these areas and react to them in the direction of the prevailing trend.
IFVG – Inverted Fair Value Gap; when price returns to such an area, it does not react to it but instead breaks through it impulsively and then retests it from the opposite side.
OB – Order Block; a candle associated with a market maker's position opening, intended to capture liquidity and establish a position in the opposite direction.


