


GBP/USD Analysis: 5-Minute Chart
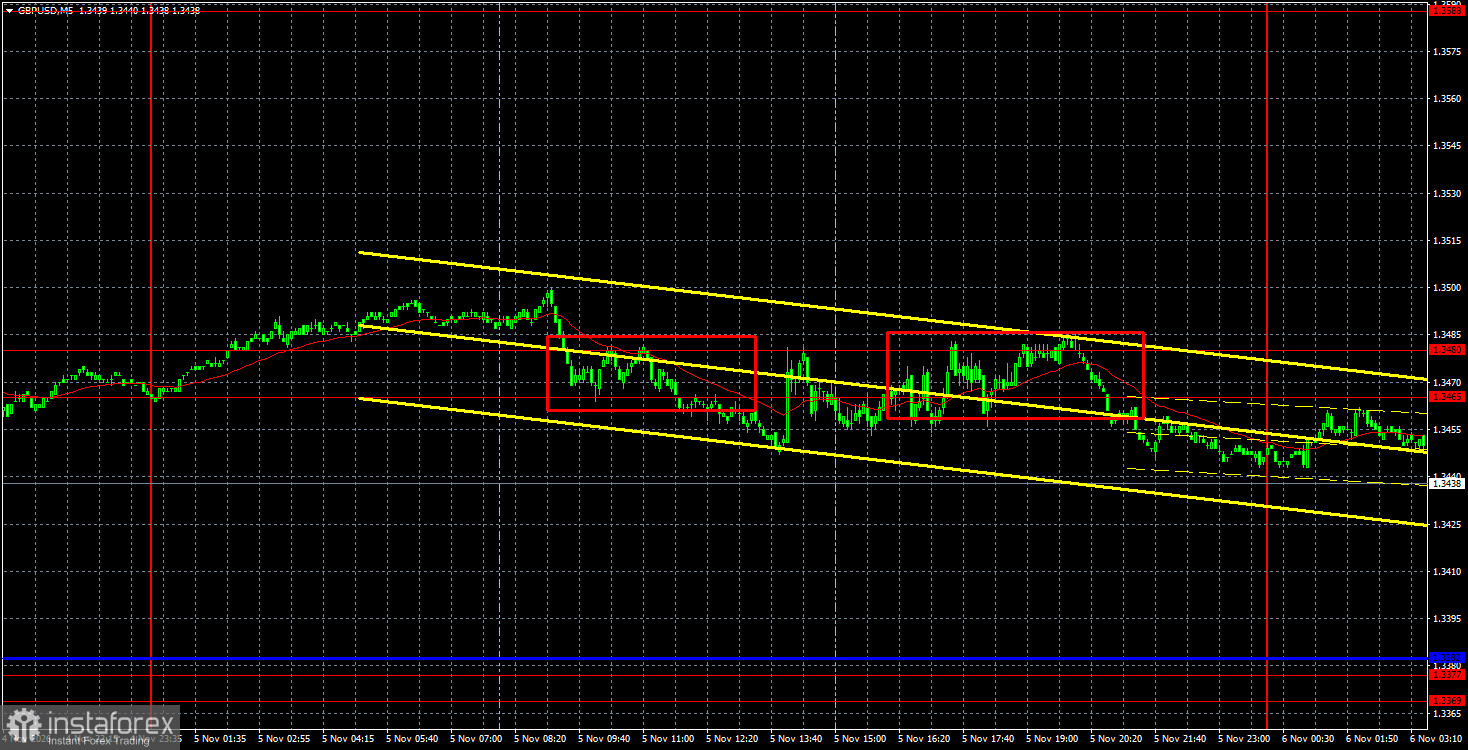
The GBP/USD currency pair also traded lower on Thursday, although a further rise in the British pound would have seemed more logical. Yesterday, the Bank of England made the expected decision to begin tightening monetary policy as part of its ongoing efforts to combat high inflation. However, the market had already anticipated this move and priced it in beforehand. Overall, the pound has performed relatively well in recent weeks.
It should also be recalled that the pound's appreciation was driven not only by expectations of monetary policy tightening by the Federal Reserve. The sideways channels on the daily and weekly timeframes remain relevant. After price has reached their lower boundaries, a move toward their upper boundaries would be a logical development. Therefore, following the correction, a resumption of the pound's upward movement is expected, regardless of the fundamental and macroeconomic background.
It should also be noted that the long-term uptrend remains intact. Returning to yesterday's Bank of England meeting, it is worth adding that the decision to raise the key interest rate was unanimous, although traders had expected two members of the Monetary Policy Committee to vote against tightening. Thus, the Bank of England's stance can be considered more hawkish than anticipated.
Today, GBP/USD movements will depend entirely on the US unemployment data and the Nonfarm Payrolls report.
From a technical perspective, the British pound continues to develop an uptrend, as indicated by the trendline. On the higher timeframes, price continues to move from the lower boundaries of the sideways channels toward their upper boundaries. From a technical standpoint, the pound's movement remains consistent with the overall market structure, and a minor correction will not alter this outlook.
On the 5-minute timeframe, two sell signals were generated on Thursday, and their implications may extend into today's session. First, the price consolidated below the 1.3465–1.3480 level and then rebounded from it. The British pound did not decline yesterday, but such a move could occur today, particularly if the US labor market and unemployment reports show stronger-than-forecast results.
COT Report
COT reports for the British pound show that non-commercial traders have maintained a dominant net short position for several consecutive months. The net position remains negative despite the continuation of the long-term uptrend. Given developments in the Middle East, it is hardly surprising that demand for the US dollar remains relatively high in 2026. The war between the United States and Iran has formally been put on hold, but hostilities could resume in the near future. The Federal Reserve's changed monetary policy stance is also supporting the dollar, while the upward trendline has been broken. However, this break occurred within a sideways market, so the uptrend is not considered complete.
In the long term, the dollar continues to weaken due to Donald Trump's policies, as clearly illustrated on the weekly timeframe. The trade war is likely to continue in one form or another for a considerable period, while Trump's policies are aimed, both directly and indirectly, at weakening the US currency. The long-term uptrend remains intact.
According to the latest COT report (dated October 27), the "Non-commercial" group opened 2,400 buy positions and 1,400 sell positions. As a result, the net position of non-commercial traders increased by 1,000 over the week.
GBP/USD Analysis: 1-Hour Chart
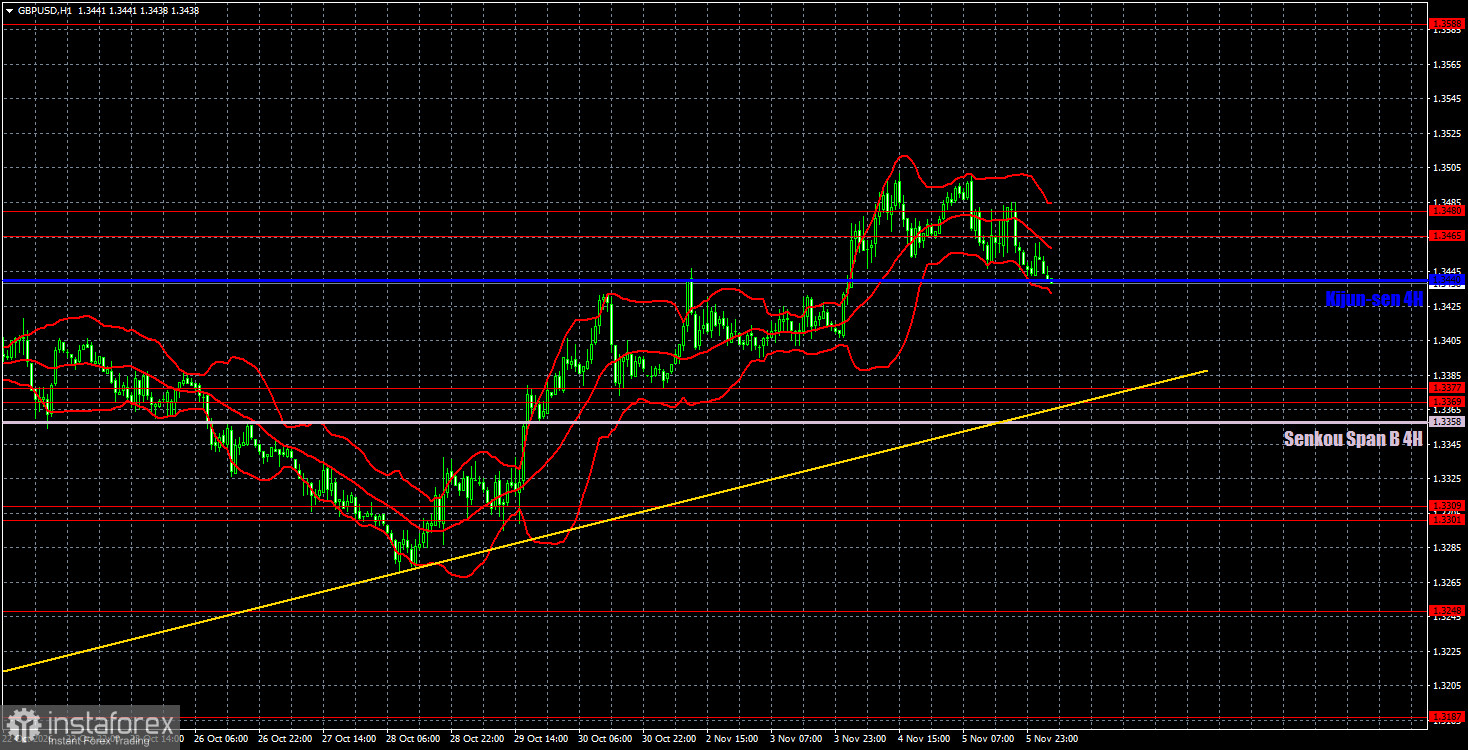
On the hourly timeframe, GBP/USD continues to develop a logical and technically consistent uptrend. On the daily and weekly timeframes, price has swept liquidity below recent lows while remaining within the sideways channels. Therefore, further appreciation of the British currency can be expected, at least toward 1.3650, which represents the upper boundary of the sideways channel on the daily chart. No fundamental or macroeconomic catalysts are required for the pound to appreciate, as GBP/USD remains within the sideways channels.
For November 6, the following key levels are identified: 1.3042–1.3050, 1.3096–1.3115, 1.3179–1.3187, 1.3248, 1.3301–1.3309, 1.3369–1.3377, 1.3465–1.3480, 1.3588, and 1.3671–1.3681. The Senkou Span B (1.3358) and Kijun-sen (1.3440) lines may also generate trading signals. It is recommended that the Stop Loss be moved to breakeven once the price has moved 20 points in the correct direction. The Ichimoku indicator lines may shift during the day, which should be taken into account when identifying trading signals.
No significant economic events or publications are scheduled in the UK today, while the US is set to release several important macroeconomic reports. Naturally, the Nonfarm Payrolls report and the unemployment rate will be particularly important, as these indicators could influence the Federal Reserve's monetary policy. However, even without considering this factor, the market reaction to these releases could be substantial.
Summary of the Analysis
Traders may consider the 1.3369–1.3382 level as a target for short positions, as two sell signals were generated in the 1.3465–1.3480 level yesterday. Consolidation above the 1.3465–1.3480 level would make 1.3588 a potential target for long positions.
Explanations for the Charts:
- Support and resistance levels – thick red lines around which price movements may end. These levels are not sources of trading signals.
- Kijun-sen and Senkou Span B lines – Ichimoku indicator lines transferred to the hourly timeframe from the 4-hour chart. These are strong technical levels.
- Extreme levels – thin red lines from which price has previously rebounded. They are sources of trading signals.
- Yellow lines – trendlines, trend channels, and other technical patterns.
- Indicator 1 on COT charts – the size of the net position held by each trader category.


