


Trade Analysis and Trading Tips for the Japanese Yen
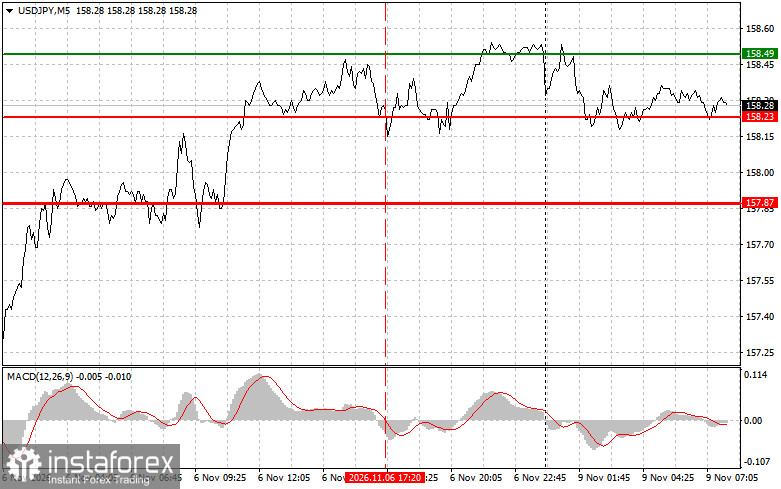
The test of the 158.23 level occurred just as the MACD indicator was beginning to move downward from the zero line, confirming that it was an appropriate entry point for a short position on the US dollar. However, the pair failed to make a significant downward move.
Last Friday, the yen continued to weaken against the dollar, although its decline was considerably more limited than it could have been. The reason was clear: the US labor market report came in significantly stronger than expected. Nonfarm payrolls increased by 165,000 in October, compared with a forecast of 65,000 and the previous month's figure of 60,000. The unemployment rate fell to 4.1% from 4.2%, while monthly wage growth reached 0.4%, against expectations of 0.3%. All these figures reinforce expectations of another Federal Reserve rate hike in December. Consequently, the already substantial interest rate differential between the United States and Japan, where the policy rate stands at 1.25%, is unlikely to narrow, while demand for the dollar is expected to remain strong.
Nevertheless, domestic economic data provided some support for the yen. On Friday morning, Japan's nominal wages increased by 4.6% year over year in September, compared with a forecast of 3.8% and the previous month's figure of 3.9%, returning to July's levels. Rising incomes are contributing to inflation in the services sector, giving the Bank of Japan another reason to consider further interest rate hikes. It is worth recalling that the central bank kept rates unchanged the previous week, with an 8-1 vote. However, more than 80% of economists expect a rate hike as early as December 17–18. These expectations helped prevent a deeper decline in the yen. As long as US economic data remain strong, the yen is likely to remain under pressure. However, wage growth figures and expectations of a December rate hike by the Bank of Japan should limit its downward potential.
As for the intraday trading strategy, the focus will be primarily on implementing Scenarios #1 and #2.
Buy Signals
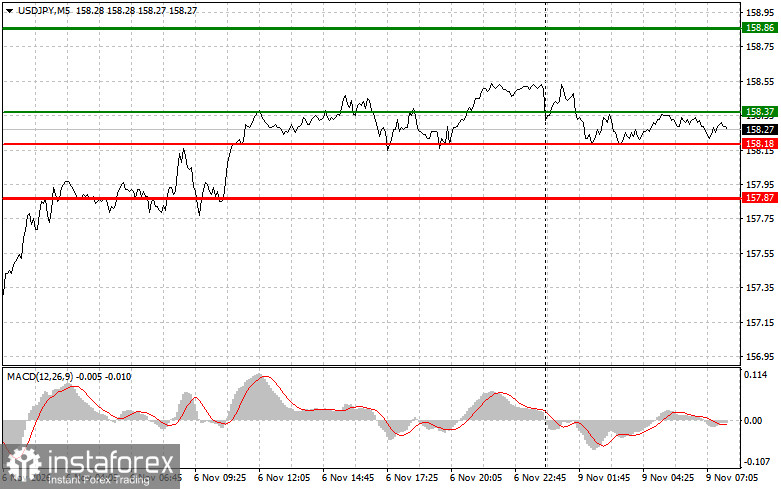
Scenario #1: USD/JPY can be bought today if the price reaches the entry level around 158.37 (the thin green line on the chart), with an upward target of 158.86 (the thicker green line on the chart). Around 158.86, the long position will be closed and a short position opened in anticipation of a 30–35-point move in the opposite direction from that level. It is preferable to consider buying the pair again during corrective pullbacks and significant declines in USD/JPY. Important! Before buying, make sure that the MACD indicator is above the zero line and has only just started rising from it.
Scenario #2: USD/JPY can also be bought today if the price tests the 158.18 level twice consecutively while the MACD indicator is in oversold territory. This would limit the pair's downward potential and trigger an upward market reversal. A rise toward the opposite levels of 158.37 and 158.86 can then be expected.
Sell Signals
Scenario #1: USD/JPY can be sold today only after the price breaks below the 158.18 level (the red line on the chart), which could trigger a rapid decline in the pair. The sellers' main target will be 157.87, where the short position will be closed and a long position opened immediately in the opposite direction, targeting a 20–25-point move upward from that level. Sellers could return to the market at any time; even a hint of a policy shift from the central bank could be enough to trigger renewed selling pressure. Important! Before selling, make sure that the MACD indicator is below the zero line and has only just started declining from it.
Scenario #2: USD/JPY can also be sold today if the price tests the 158.37 level twice consecutively while the MACD indicator is in overbought territory. This would limit the pair's upward potential and trigger a downward market reversal. A decline toward the opposite levels of 158.18 and 157.87 can then be expected.
What the Chart Shows
- Thin green line – the entry price at which the trading instrument can be bought.
- Thick green line – the estimated price level at which Take Profit orders can be placed or profits can be closed manually, as further upward movement above this level is considered unlikely.
- Thin red line – the entry price at which the trading instrument can be sold.
- Thick red line – the estimated price level at which Take Profit orders can be placed or profits can be closed manually, as further downward movement below this level is considered unlikely.
- MACD indicator. When entering the market, it is important to take overbought and oversold conditions into account.
Important. Beginner Forex traders should exercise extreme caution when making trading decisions. Before the release of major fundamental reports, it is generally best to stay out of the market to avoid exposure to sharp exchange rate fluctuations. If trading during news releases, always use stop-loss orders to minimize potential losses. Without stop-loss orders, the entire trading account can be depleted very quickly, especially when money management rules are not followed and large position sizes are used.
It is also important to remember that successful trading requires a clear trading plan, such as the one outlined above. Making spontaneous trading decisions based on current market conditions is fundamentally a losing strategy for an intraday trader.


