


Bitcoin failed to recover in the first half of the day and is again moving toward the $73,500 low. On Monday, positions worth $1.12 billion were forcibly liquidated, and that is what turned an ordinary pullback into a crash. The price is now below the 50?week moving average at $75,500 and has approached the 21?week MA at $73,000 — the last major support on the weekly chart.

There were two immediate triggers for the pressure. Nvidia's board announced an independent investigation into reports that Jensen Huang might have been targeted for exploitation by foreign intelligence services. The company said it sees no grounds to believe national security or trade secrets were compromised, and China's foreign ministry rejected the allegations. Nasdaq futures continue to slide, and for Bitcoin — whose correlation with US stocks is about 0.8 — any turbulence in the tech sector translates directly into downside pressure.
Next up are Tuesday and Friday. In September, US consumer prices rose 3.7% year?on?year, and more than half of the monthly increase was driven by gasoline, which jumped 9.1%. The CPI report for October will be released on Tuesday, and the PPI for October on Friday. The market is currently pricing in a 78.8% probability of a 25?bp rate hike in December, which will continue to weigh on the crypto market.
But there is a factor that could help buyers: if oil falls to $75 per barrel, Bitcoin's negative correlation with oil could work in its favor and push it higher. For now, WTI is holding near $90, and Donald Trump keeps the market on edge.
Technical analysis and recommendations
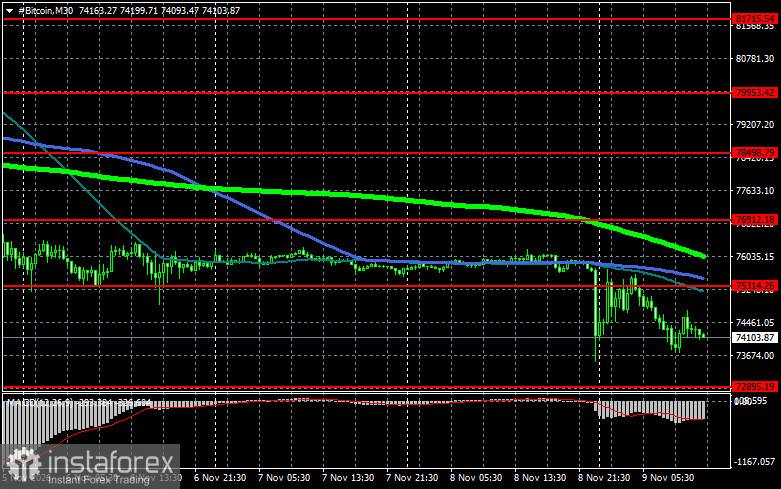
Bitcoin
Buyers are targeting a return to $75,300, which would open a direct route to $76,900 and then toward $78,500; breaking that level would signal attempts to restore the bull market. On the downside, I expect buyers at $72,800. A move back below that area could quickly push BTC toward $71,100. The farther target on a deeper drop is around $69,400.
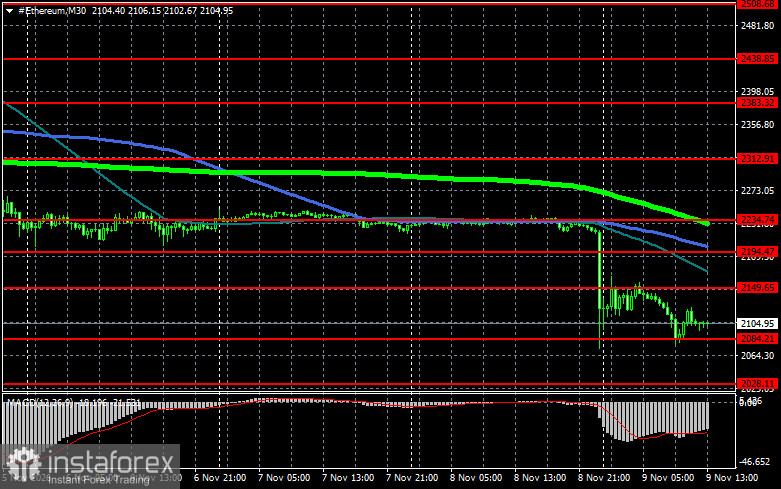
Ethereum
A clear close above $2,149 opens the way to $2,194. The farther target is the high near $2,234; breaking that level would signal strengthening bullish sentiment and renewed buyer interest. On the downside, I expect buyers at $2,084. A return under that area could quickly push ETH toward $2,028, with a deeper target around $1,974.
What's on the chart
- The red lines represent support and resistance levels, where the price is expected to either pause or react sharply.
- The green line shows the 50-day moving average.
- The blue line is the 100-day moving average.
- The lime line is the 200-day moving average.
Price testing or crossing any of these moving averages often either halts movement or injects fresh momentum into the market.


