Main Quotes Calendar Forum
flag

FX.co ★ Technical analysis of gold for January 11, 2017

parent
Forex Analysis:::2017-01-11T08:05:57

Technical analysis of gold for January 11, 2017

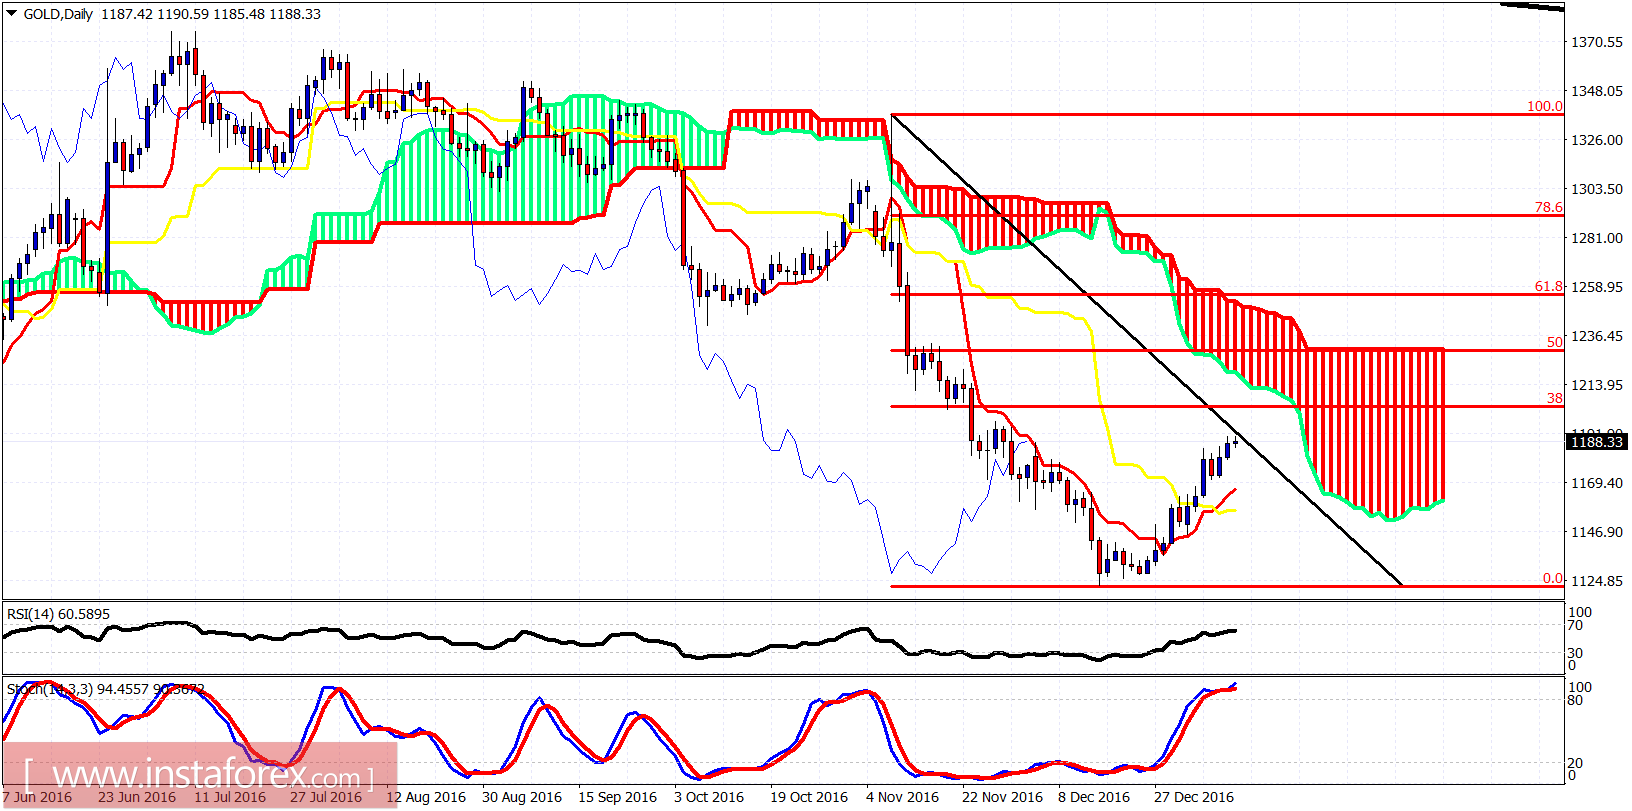
Gold price made a new higher high yesterday but it was not confirmed on the 4-hour chart by the RSI, which means that bulls need to be very cautious as a pullback is imminent. Trend remains bullish in the short-term and I continue to target $1,200-$1,220 for a reversal.

Technical analysis of gold for January 11, 2017

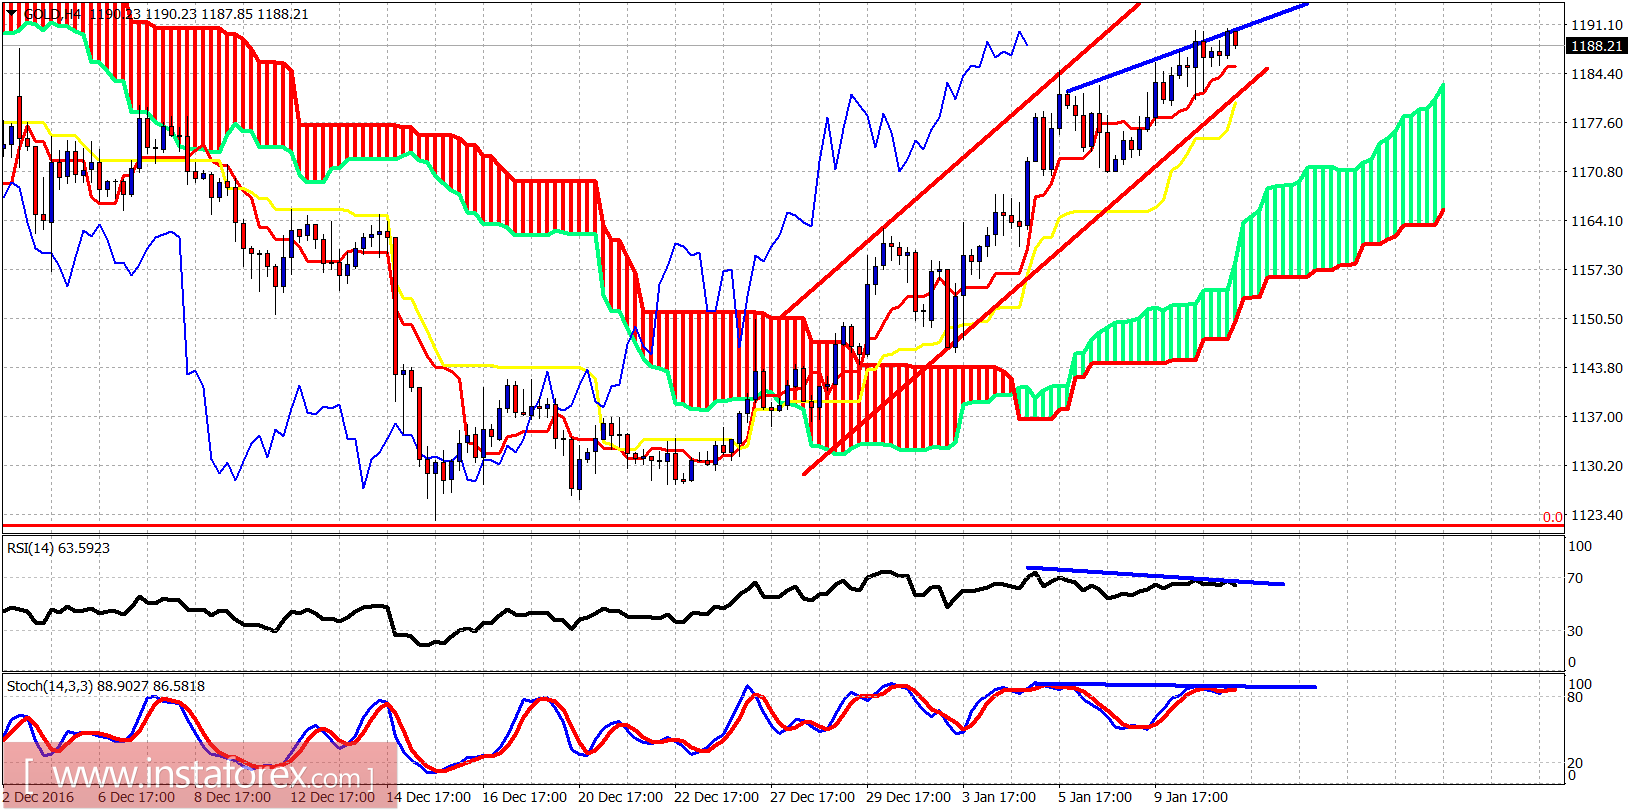
Red lines- bullish channel

Blue lines - divergence signs

Gold price continues to trade inside the bullish channel and above the 4-hour Ichimoku cloud. There are bearish divergence signs that provide a warning for Gold bulls. A pullback is justified and expected in the short term. Short-term support is at $1,180 and resistance at $1,200-$1,220.

Technical analysis of gold for January 11, 2017

Gold price should at least reach the 38% Fibonacci retracement of the decline from the post election highs at $1,210 and ideally it would test the daily Ichimoku cloud resistance at $1,215-20. A pullback should be expected after that. Support is at $1,150-60. Gold bulls will need to see a higher low and an upward reversal in order to assume that $1,122 is an important long-term low.
Analyst InstaForex
Share this article:
parent
loader...
all-was_read__icon
You have watched all the best publications
presently.
We are already looking for something interesting for you...
all-was_read__star
Recently published:
loader...
More recent publications...