


The index plummeted after Donald Trump's first press conference as US president, testing the support zone of 101.39. Currently, USDX is consolidated below the 200 SMA at H1 chart and if we see a breakout below the 101.39 level, then it can reach the 100.00 level on a mid-term basis. However, if that demand zone holds across the board, then the index could rally to re-test the 102.29 level.
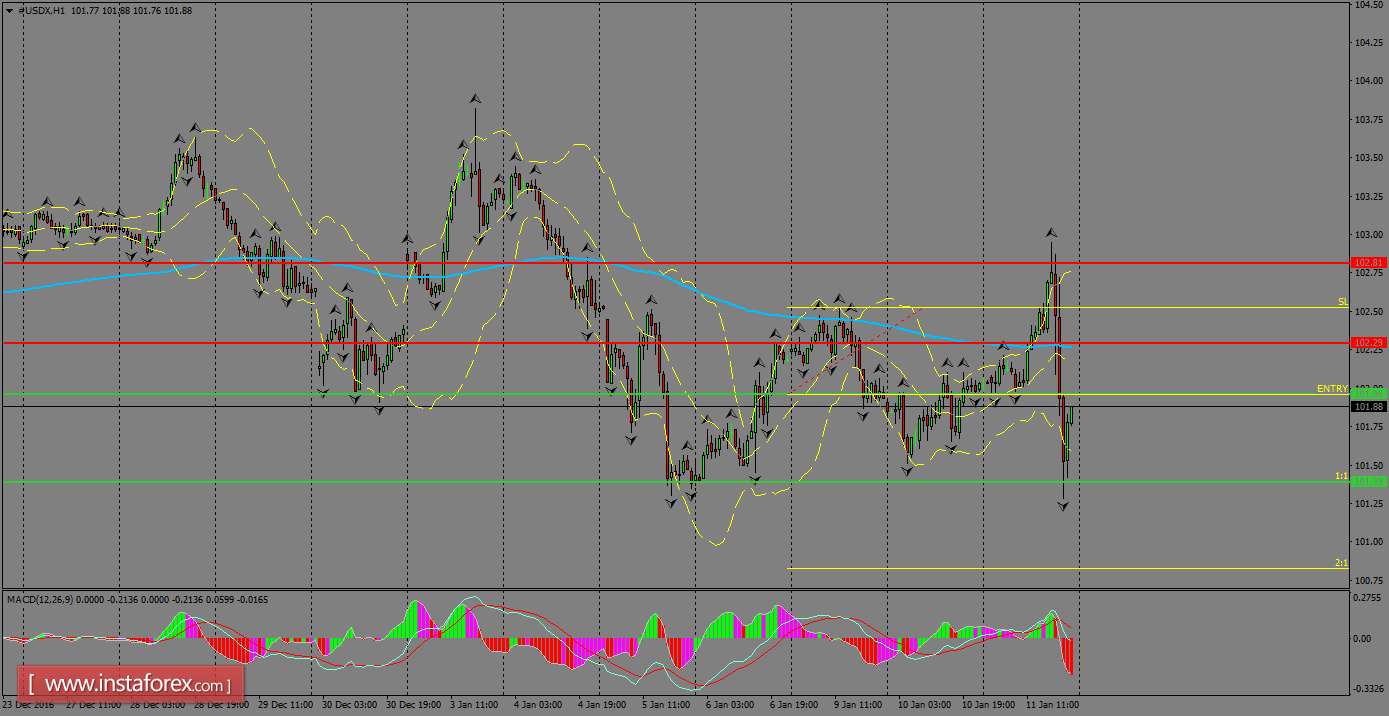
H1 chart's resistance levels: 102.29 / 102.81
H1 chart's support levels: 101.96 / 101.39
Trading recommendations for today: Based on the H1 chart, place sell (short) orders only if the USD Index breaks with a bearish candlestick; the support level is at 101.96, take profit is at 101.39 and stop loss is at 102.54.


