Main Quotes Calendar Forum
flag

FX.co ★ Technical analysis of gold for January 16, 2017

parent
Forex Analysis:::2017-01-16T08:18:41

Technical analysis of gold for January 16, 2017

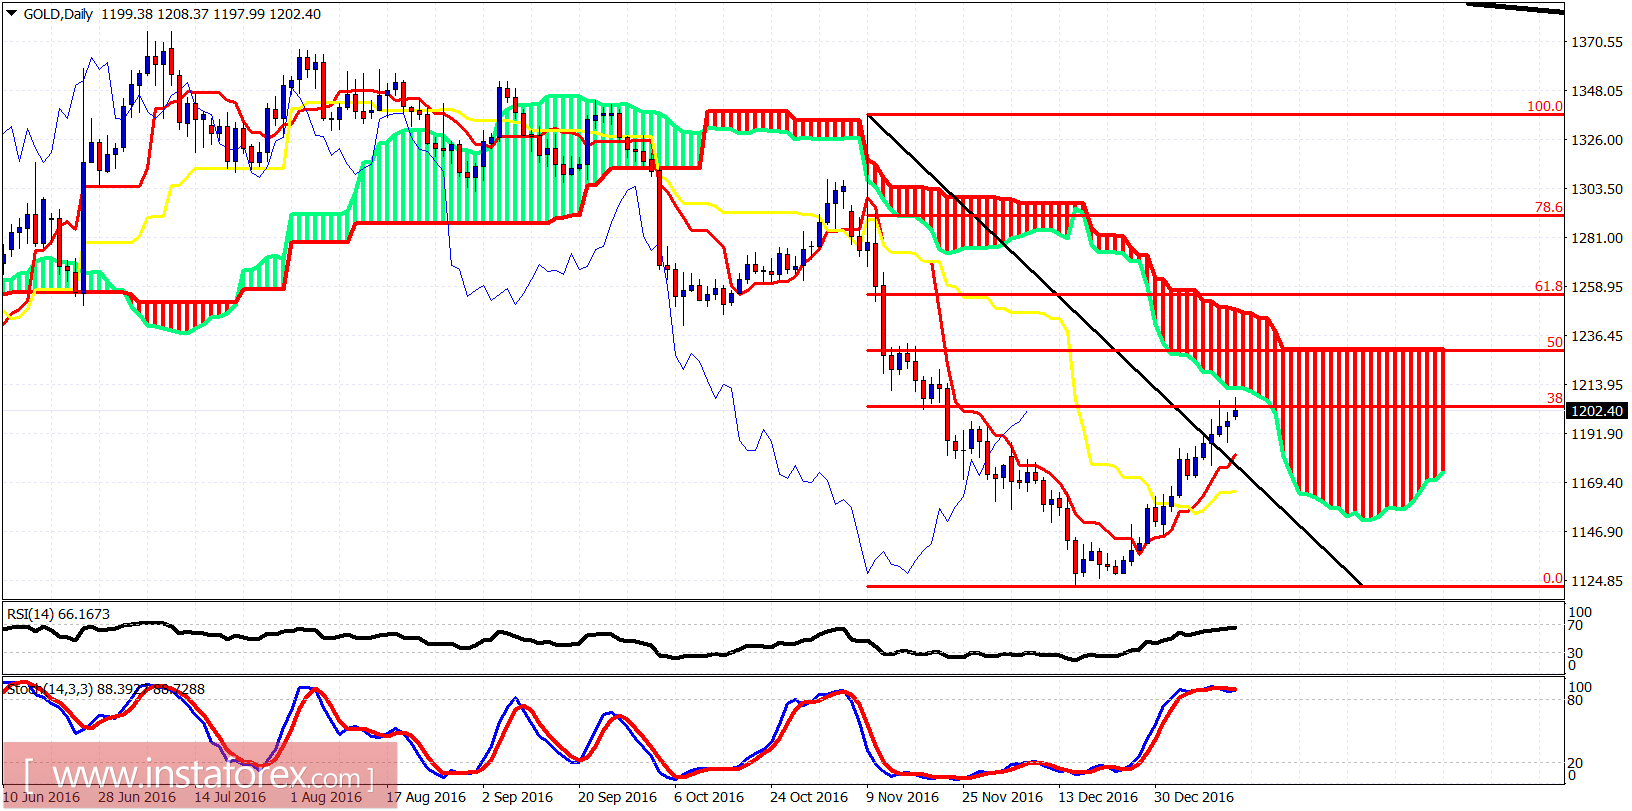
Gold price remains inside the bullish channel making higher highs and higher lows. However there are several short-term warning signs that a pullback is imminent. Bulls need to be very careful especially if price breaks below $1,187.

Technical analysis of gold for January 16, 2017

Red lines - bullish channel

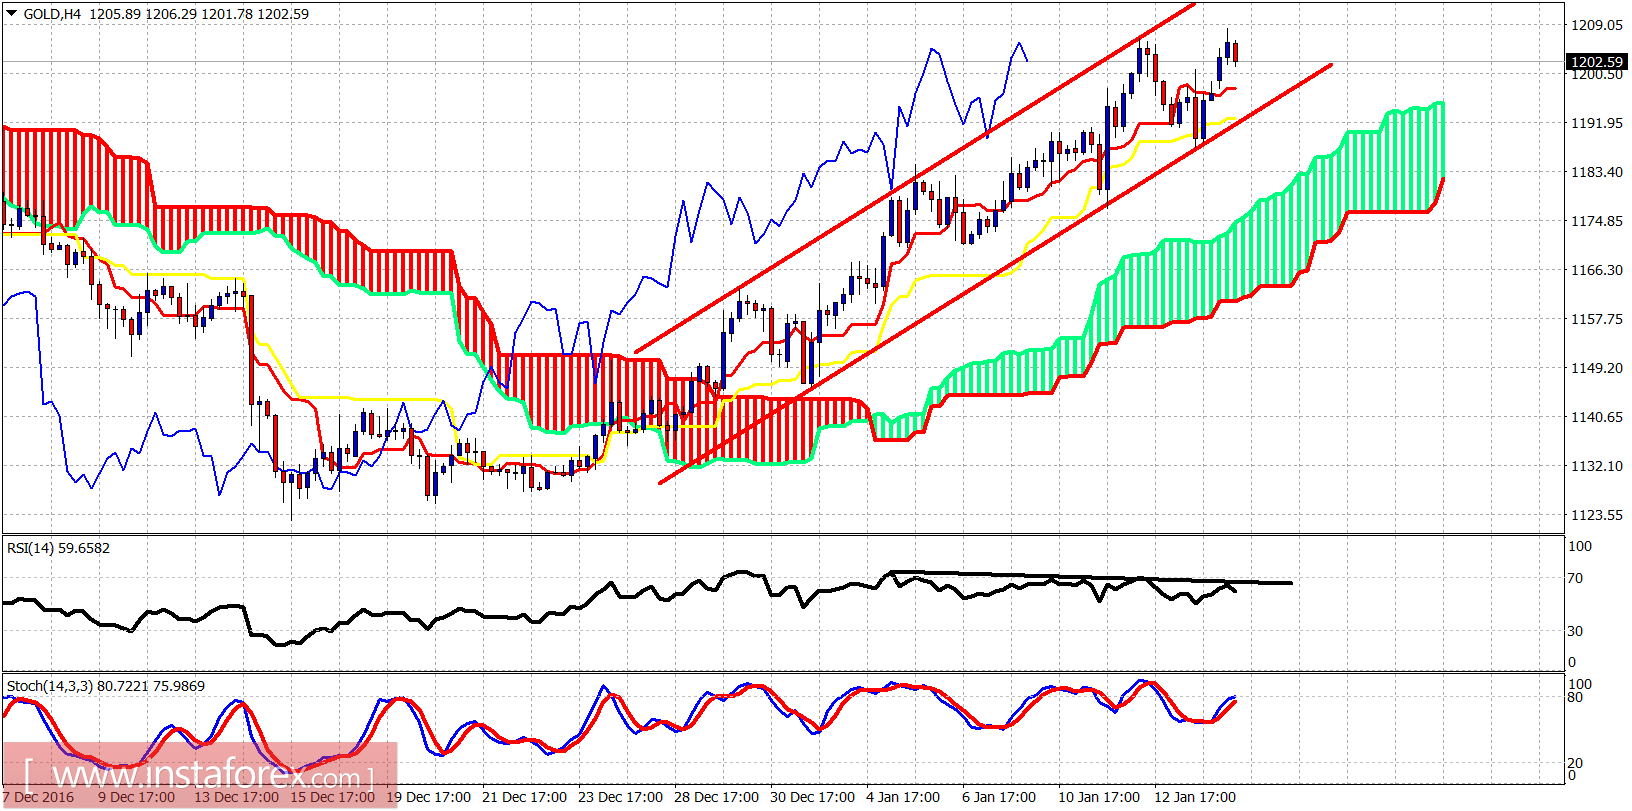
Price is above the Ichimoku cloud. The 4-hour RSI is diverging. A pullback is very close. We should at least see price move towards $1,170. Trend remains bullish. The 38% Fibonacci retracement of the entire rise is at $1,175. The 61.8% Fibo is at $1,155.

Technical analysis of gold for January 16, 2017

Gold price has also reachedthe 38% Fibonacci retracement resistance of the decline from the post election highs to the $1,122 lows. Price remains below the daily cloud resistance. A rejection here will be a bearish sign but also justified. The bigger question is whether we will make a higher low or break below $1,122.
Analyst InstaForex
Share this article:
parent
loader...
all-was_read__icon
You have watched all the best publications
presently.
We are already looking for something interesting for you...
all-was_read__star
Recently published:
loader...
More recent publications...