Main Quotes Calendar Forum
flag

FX.co ★ Technical analysis of gold for January 17, 2017

parent
Forex Analysis:::2017-01-17T07:48:24

Technical analysis of gold for January 17, 2017

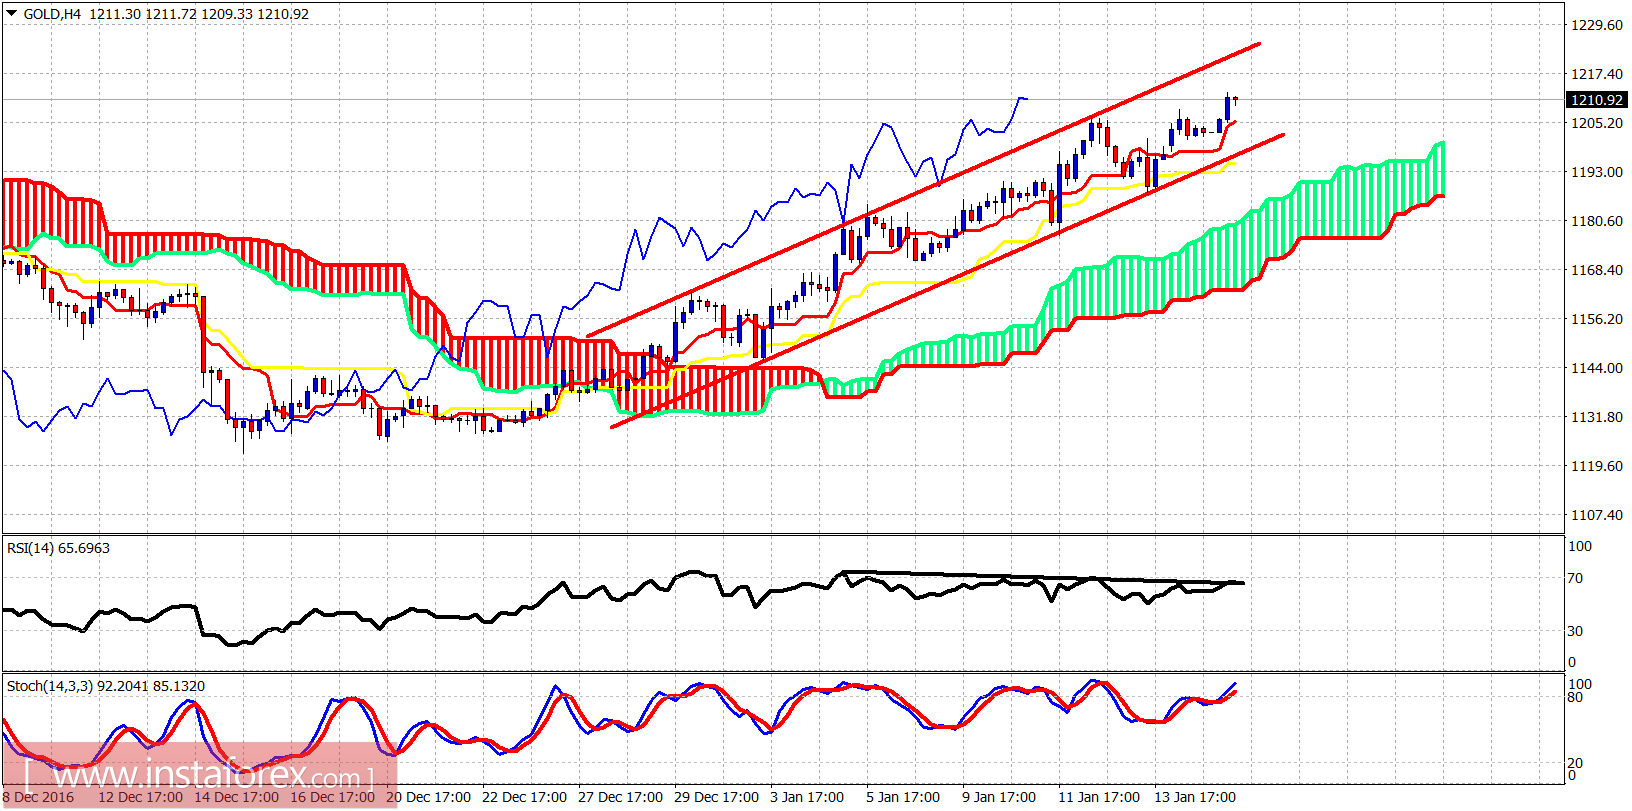
As expected, gold is making higher highs this morning as the price remains inside the bullish channel. There are several warning signs as the RSI is diverging which justifies a pullback in the short term. This pullback will be confirmed once the price breaks below $1,193.

Technical analysis of gold for January 17, 2017

Red lines - bullish channel

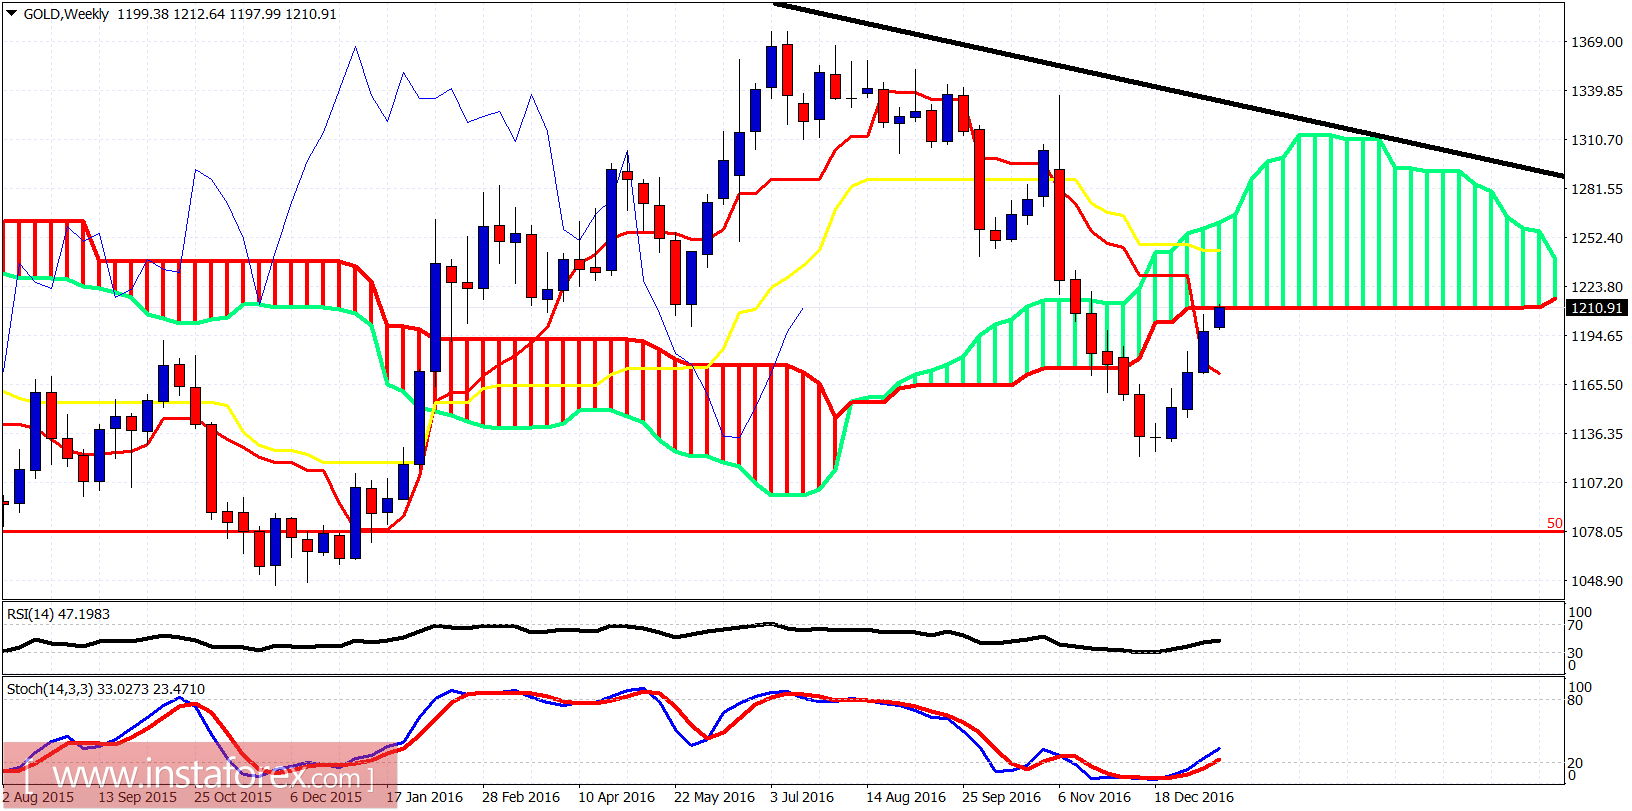
Black line - divergence

Gold price is trading above both the Tenkan- and Kijun-sen (red and yellow line indicators). Trend remains bullish in the short term. Price has reached our target at $1,200-$1,220 which acts as a key medium-term resistance. I expect a rejection from this area as there are also bearish divergence signs on the 4 hour chart.

Technical analysis of gold for January 17, 2017

On a weekly basis, the gold price reached the lower boundary of the Kumo cloud as was initially expected. The oscillators are just turning upwards and this is a bullish long-term sign. Gold may find the current resistance too strong to be broken and might pull back for a couple of weeks. Bulls need to be cautious.
Analyst InstaForex
Share this article:
parent
loader...
all-was_read__icon
You have watched all the best publications
presently.
We are already looking for something interesting for you...
all-was_read__star
Recently published:
loader...
More recent publications...