Main Quotes Calendar Forum
flag

FX.co ★ Technical analysis of gold for January 18, 2017

parent
Forex Analysis:::2017-01-18T08:11:23

Technical analysis of gold for January 18, 2017

Gold price remains inside the bullish channel and is making higher highs and higher lows. Trend remains bullish in the short term. We might see a pullback towards $1,200-$1,210. There are several divergence signs but no reversal signal.

Technical analysis of gold for January 18, 2017

Red lines - bullish channel

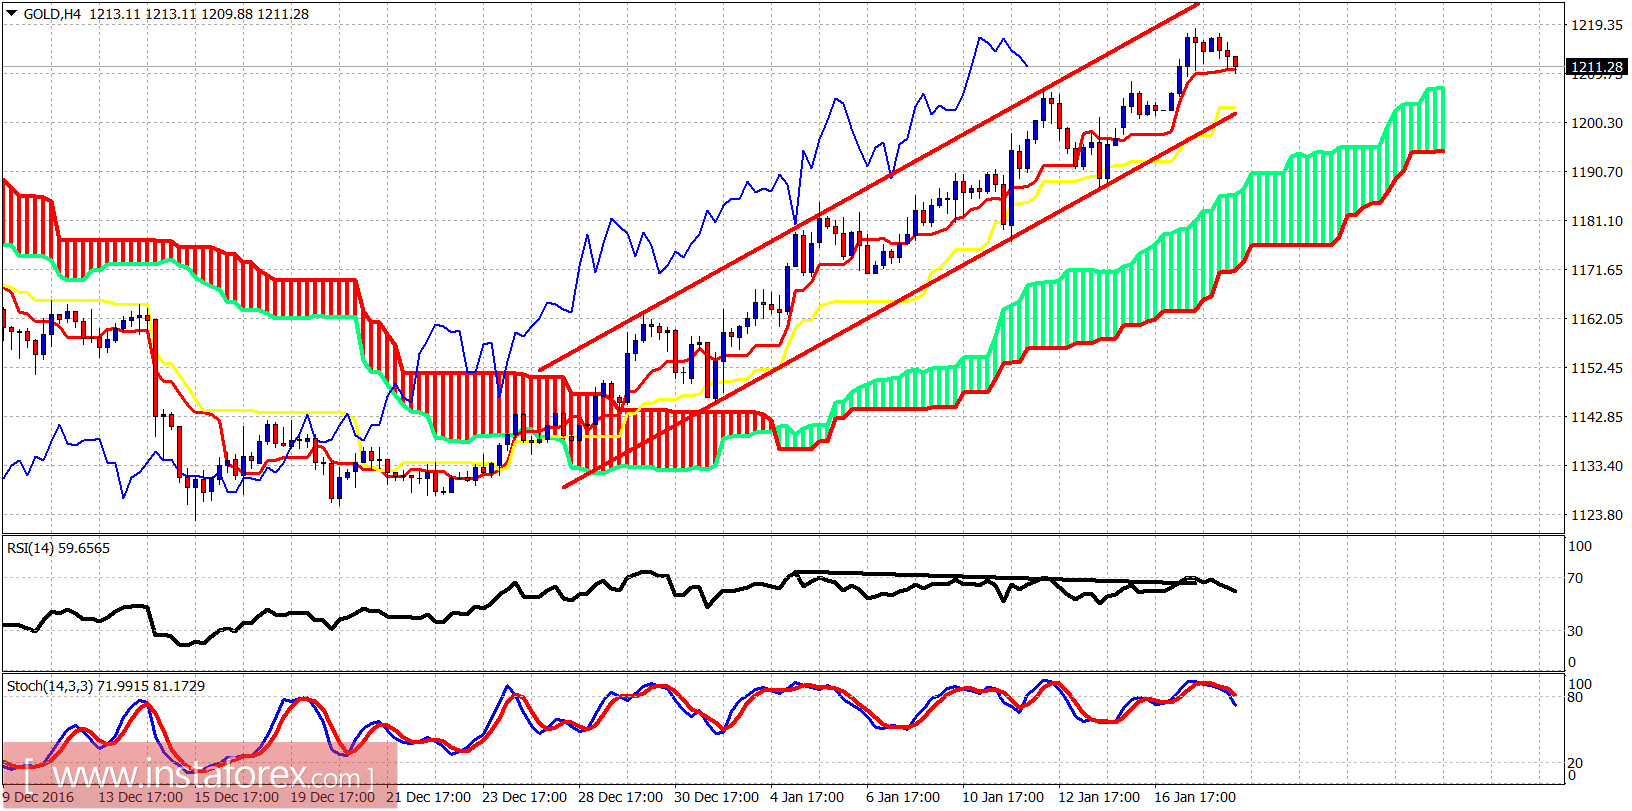
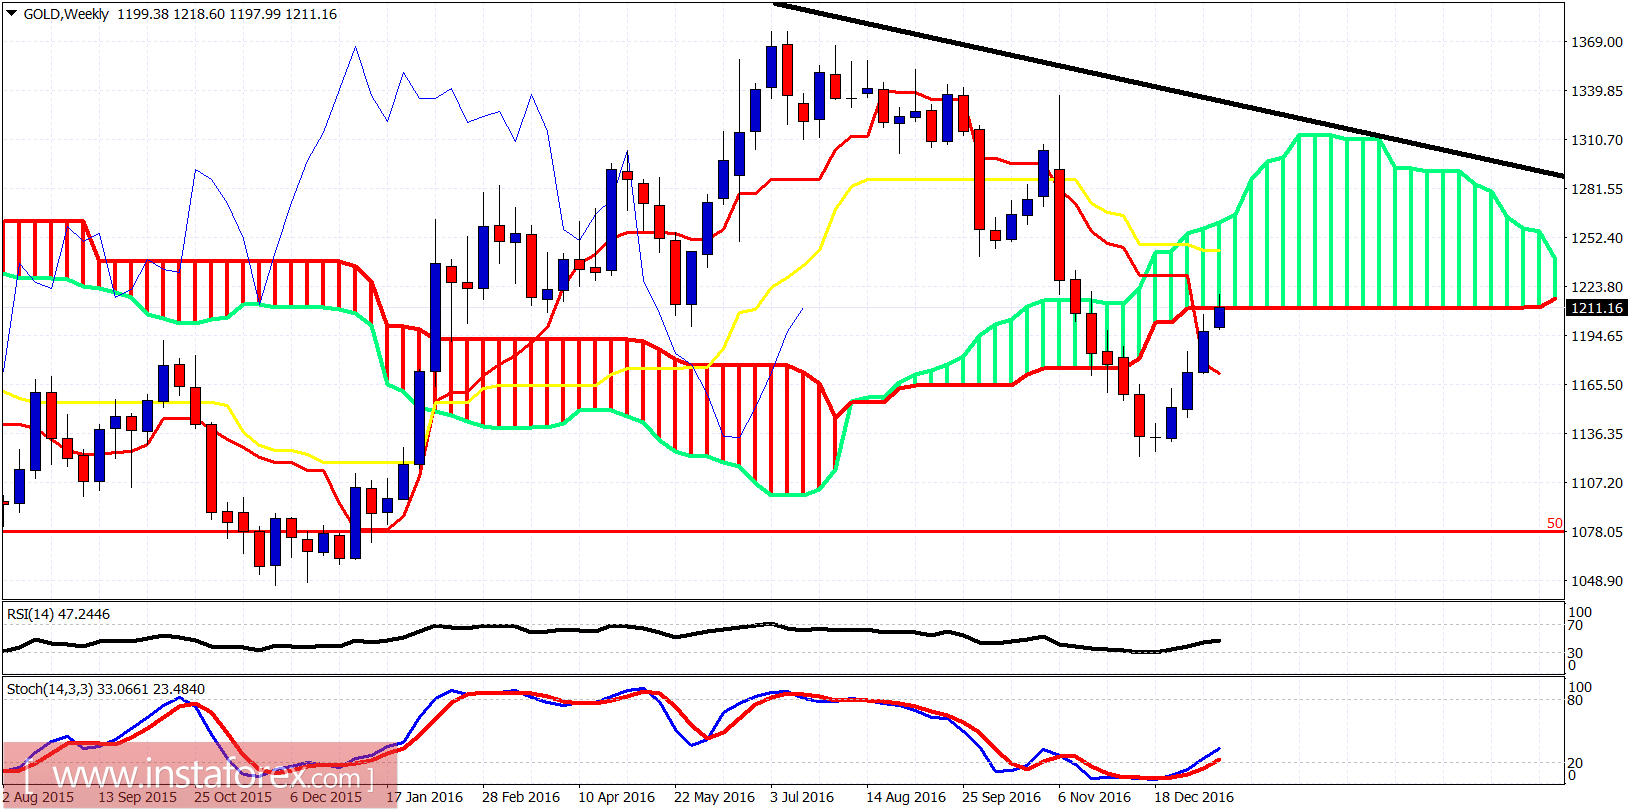
Gold price is trading above the Ichimoku cloud and inside the bullish channel. The RSI is diverging on the 4-hour chart but there is no reversal signal yet. This upward move in Gold above $1,200 increases the chances that an important long-term low is in at $1,122. Even if price pulls back, we should expect a higher low around $1,180-60 before the next big upward move.

Technical analysis of gold for January 18, 2017

As expected for some time now, Gold price has reached the lower cloud boundary at $1,220. This is important resistance area. Gold price has also broken above the tenkan-sen (red line indicator) and could move towards the kijun-sen (yellow line indicator) at $1,250 before a bigger pullback starts. I remain longer-term bullish

about Gold.

Analyst InstaForex
Share this article:
parent
loader...
all-was_read__icon
You have watched all the best publications
presently.
We are already looking for something interesting for you...
all-was_read__star
Recently published:
loader...
More recent publications...